
The FlowTraq Command Line Interface (CLI) provides an easy way for custom scripts and third party applications to query FlowTraq Server for flow information.
The CLI tools are installed with FlowTraq Server in the /path/to/flowtraq/clitools directory.
![[Tip]](../common/images/admon/tip.png) | Tip |
|---|---|
The CLI tools, like the client, connect to FlowTraq Server via 9640/tcp. You don't have to run the CLI tools from the host on which you installed FlowTraq Server. |
There are eight command line tools.
-
ftsq FlowTraq Session Query Retrieval Tool. The
ftsqcommand allows you to retrieve bi-directional session data assembled from the unidirectional flow data. This command accepts as parameters a report type, a timeframe, and an optional filter string to narrow the scope of the report. It presents its results as CSV or an ASCII table.-
ftstat FlowTraq Statistical Query Retrieval Tool. Use
ftstatto retrieve the kinds of statistical reports you can retrieve in a FlowTraq Workspace, such as "Hosts Ranked by Bytes Sent" or "Applications ranked by Sessions Received". Like theftsqcommand,ftstataccepts a timeframe and filter string. It presents tabular results as either CSV or an ASCII table.-
ftname FlowTraq Friendly Names. The
ftnamecommand allows users to set userfriendly names for objects such as IP addresses, exporters, interfaces, traffic groups, and autonomous systems.-
ftum FlowTraq User Management. The
ftumcommand allows administrative users to create and delete users, reset passwords, and grant administrative privileges. The use of this tool is covered in the Administration Section of this manual.-
fttg FlowTraq Traffic Groups. The
fttgcommand allows administrative users to create traffic groups for tagging flows upon ingress. The use of this tool is covered in the Administration Section of this manual.-
ftgroup FlowTraq Partition Management The
ftgroupcommand allows administrative users to create and manage partitions. The use of this tool is covered in the Administration Section of this manual.-
ftnbi FlowTraq Alert and Policy Management The
ftnbicommand allows administrative users to create and manage policies, and allows all users to retrieve alerts. The use of this tool is covered in the Alerting section of this manual.-
ftplugin FlowTraq Plugin Management The
ftplugincommand allows administrative users to view and manage plugins.
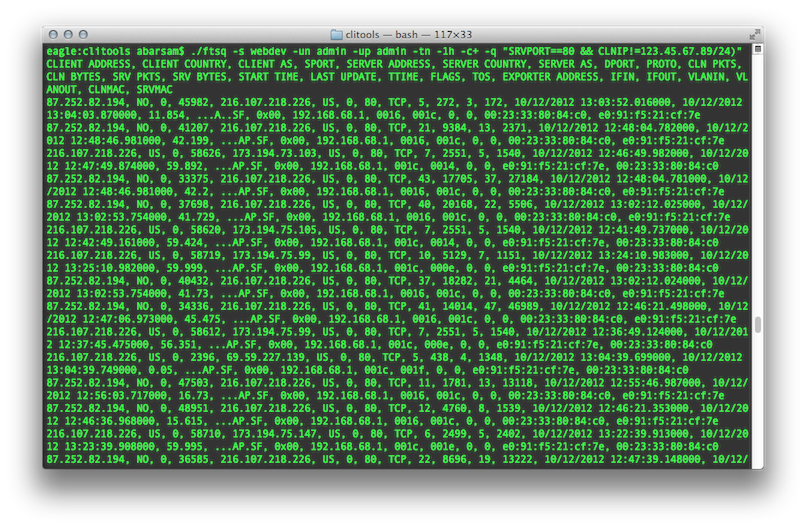
To retrieve raw session records, use the ftsq command.
For example, the following invocation of ftsq returns all records in the last hour to HTTP servers with a client address that is outside the 123.45.67.89 class-C block, in CSV format with a header line:
The ftsq commands accepts a wide range of parameters. Some are optional and some are required.
You should always specify a FlowTraq Server to log in to (or accept the default, localhost), supply a username and password, and select a timeframe over which to perform your query (or accept the default, which is the last 15 minutes).
Optionally, you may supply a filter string to further narrow your query, and you may specify a preference for how you would like the command's output formatted.
Most of the parameters are self-explanatory, but timeframe specification and the filter string syntax are described in depth in Section 3.4.3, “Time Navigation” and Section 3.4.4, “Filter String Syntax”. First, however, please review the complete list of parameters:
Table 3.1. Connection Parameters
| Parameter | Description |
|---|---|
-s SERVER
| Address (or hostname) of FlowTraq server to query. (Default: localhost.) |
-p PORT
| Port on which to connect to FlowTraq server. (Default: 9640.) |
Table 3.2. Login Parameters
| Parameter | Description |
|---|---|
-un USER
| Username for profile login. Required. |
-up PASS
| Password for profile login. (Note: If you do not use -up , you will be prompted to enter a password.)
|
-us [SESSIONKEY]
| Authenticate with a session key rather than with a username and password, or generate a session key. (For more information, see Section 3.4.8, “Session Key Reauthentication”). |
Table 3.3. Timeframe Parameters
| Parameter | Description |
|---|---|
-te "MM/DD/YY hh:mm:ss.microsec"
| Specify an absolute timeframe starting time. Must be used in conjunction with -tl . Cannot be used in conjunction with -tn . |
-tl "MM/DD/YY hh:mm:ss.microsec"
| Specify an absolute timeframe ending time. Must be used in conjunction with -te . Cannot be used in conjunction with -tn . |
-tn RELTIME
| Specify a timeframe relative to now (e.g. -tn -1h30m for the last 1.5 hours). Default: last 15 minutes. Cannot be used in conjunction with -te or -ts. Please see Section 3.4.3, “Time Navigation” for more information on valid specifiers for RELTIME. |
Table 3.4. Filtering Parameters
| Parameter | Description |
|---|---|
-e IP
| Filter for flows from exporter with a given IP address. Default: all exporters. Must be specified before -ei and -ef . |
-ei INDEX
| Filter for flows with a given interface index of exporter. Default: all interfaces. |
-ef [nf1|nf5|nf9|sf2|sf4|sf5]
| Filter for flows from a given exporter version. Default: any version. |
-snd
|
The -snd parameter indicates that FlowTraq should only count outbound packets, bytes, or sessions when generating rankings. May not be used in conjunction with the -rcv parameter. |
-rcv
|
The -rcv parameter indicates that FlowTraq should only count inbound packets, bytes, or sessions when generating rankings. May not be used in conjunction with the -snd parameter.
|
-q "RAWQUERY"
| Specify a query string (enclose in ""-pair). See Section 3.4.4, “Filter String Syntax” for a description of the query string syntax. |
![[Important]](../common/images/admon/important.png) | Important |
|---|---|
Note that the |
Table 3.5. Output Parameters
| Parameter | Description |
|---|---|
-w NUM
|
Create a time series with NUM slices. Default: don't create a time series.
|
-r num
| Number of rows per table. Default: 128. |
-c
| Use CSV output format. |
-c+
| Use CSV output format with headers and summaries. |
-v
| Display a progress indicator. Useful for longer summary queries. |
-g filename.tga
| If specified, in addition to writing the tabular result to the terminal, the command will write a stack chart to filename.tga . Default: don't write a stack graph.
|
-gx X
| The width, in pixels, of the image produced. May only be used in conjunction with -g and -gy. |
-gy Y
| The height, in pixels, of the image produced. May only be used in conjunction with -g and -gx. |
| Important |
|---|---|
Note that the |
| Important |
|---|---|
Note that the |
Both ftstat and ftsq require a timeframe specification.
You can set an absolute timeframe by specifying start and end times with -te and -tl. Specify both a starting and ending time in the following format: "MM/DD/YY hh:mm:ss.microsec".
Alternatively, you can specify a timeframe relative to now by using the -tn option, For example, -tn -1h specifies the last hour, -tn -1d12h specifies the day and a half, and -tn -5m specifies the last five minutes.
Valid time specifiers for the -tn option are as follows:
-
s Seconds
-
m Minutes
-
h Hours
-
d Days
-
w Weeks
-
M Months
-
y Years
| Important |
|---|---|
Time specifiers must be given in order of magnitude. This means that |
All data retrieval commands accept an optional filter string. The filter string is used to select which sessions to include in the retrieval.
Filter strings consist of statements, such as SRVIP==123.45.67.89 ("server IP address is 123.45.67.89") and CLNPKTS>=100 ("number of client-transmitted packets is at least 100"), which may be combined using logical operators.
You can combine statements using the following logical operators:
-
&& logical 'AND'
-
|| logical 'OR'
-
^| logical 'XOR' (exclusive-OR)
-
! logical 'NOT'
For example: SRVIP==123.45.67.89 && CLNIP==89.67.45.123 .
| Tip |
|---|---|
You can build compound statements and specify precedence by using parentheses. For example, you might use: (SRVPORT==22 && SRVIP==123.45.67.89) || (SRVIP==89.67.45.123) to specify all sessions which are either connections on port 22 to 123.45.67.89, or connections on ANY port to 89.67.45.123. |
Statements are formed by combining field names (such as SRVIP) with comparators (such as ==) and values to compare them to. The following lists the available comparators and field names.
Comparators
-
== equals
-
!= does not equal
-
>= greater than or equal to
-
<= less than or equal to
-
> greater than
-
< less than
Table 3.6. Filter String Fields
| Field | Description | Valid Comparators |
|---|---|---|
SRVIP
| server IP (or CIDR), IPv4: 123.45.67.89/32, or IPv6: fed9::c0:ffee/128 |
==, !=
|
CLNIP
| client IP (or CIDR), same as SRVIP |
==, !=
|
ADDR
| IP or CIDR block |
==, !=
|
SRVPORT
| server port, integer number |
==, !=, >=, <=, >, <
|
CLNPORT
| client port, integer number |
==, !=, >=, <=, >, <
|
PORT
| port, integer number |
==, !=, >=, <=, >, <
|
PROTO
| protocol, one of TCP/UDP/ICMP, or integer number |
==, !=, >=, <=, >, <
|
CLNPKTS
| number of client transmitted packets, integer number |
==, !=, >=, <=, >, <
|
SRVPKTS
| number of server transmitted packets, integer number |
==, !=, >=, <=, >, <
|
PACKETS
| match either of the packet fields (server or client), integer number |
==, !=, >=, <=, >, <
|
TOTPKTS
| total packets (server plus client), integer number |
==, !=, >=, <=, >, <
|
CLNBYTS
| number of client transmitted bytes, integer number |
==, !=, >=, <=, >, <
|
SRVBYTS
| number of server transmitted bytes, integer number |
==, !=, >=, <=, >, <
|
BYTES
| match either of the bytes fields (server or client), integer number |
==, !=, >=, <=, >, <
|
TOTBYTS
| total bytes (server plus client), integer number |
==, !=, >=, <=, >, <
|
TTIME
| total time of session, floating point, in seconds: e.g. 2.5 |
==, !=, >=, <=, >, <
|
STRTIME
| start time, time notation: MM/DD/YY hh:mm:ss.fracsec |
==, !=, >=, <=, >, <
|
UPDTIME
| time of last update, time notation: MM/DD/YY hh:mm:ss.fracsec |
==, !=, >=, <=, >, <
|
TOS
| ToS, QoS, DiffServ, integer number 0-256 |
==, !=, >=, <=, >, <
|
CLNCC
| client country code, two characters: 'US', 'NL' |
==, !=
|
SRVCC
| server country code, same as client country code |
==, !=
|
INIF
| inbound interface, integer number 0-65536 |
==, !=, >=, <=, >, <
|
OUTIF
| outbound interface, integer number 0-65536 |
==, !=, >=, <=, >, <
|
IFACE
| match either of the interface fields (inbound or outbound), integer number 0-65536 |
==, !=, >=, <=, >, <
|
INVLAN
| inbound VLAN, integer number 0-4096 |
==, !=, >=, <=, >, <
|
OUTVLAN
| outbound VLAN, integer number 0-4096 |
==, !=, >=, <=, >, <
|
VLAN
| match either of the VLAN fields (inbound or outbound), integer number 0-4096 |
==, !=, >=, <=, >, <
|
CLNAS
| client autonomous system number, integer number |
==, !=, >=, <=, >, <
|
SRVAS
| server autonomous system number, integer number |
==, !=, >=, <=, >, <
|
ASN
| match either of the autonomous system number fields (server or client), integer number |
==, !=, >=, <=, >, <
|
ASAEVT
| ASA event code, integer number |
==, !=, >=, <=, >, <
|
ASAEXTEVT
| ASA extended event code, integer number |
==, !=, >=, <=, >, <
|
FLAGS
| TCP flags in session, one of: 'FSYN' (syn), 'FACK' (ack), 'FRST' (reset), 'FFIN' (fin), 'FPSH' (push), 'FECN' (ECN-echo), 'FCWR' (congestion window reduced), 'FURG' (urgent) |
==, !=
|
EXPIP
| IP of the device that exported the record |
==, !=
|
EXPV
| flow version, use: 1, 5, 7, 9 (NetFlow v1/5/7/9), 18, 20, 21 (sFlow v2/4/5) |
==, !=
|
The FlowTraq Statistical Query Retrieval command ftstat creates tables and graphs of grouped items that are ranked by some criterion. For example, you can retrieve the list of hosts that sent the most packets during a given timeframe or the list of hosts that received the most packets during the same. You can also find out which port/application accounted for the most bytes on your network, find which host pair exchanged the most bytes, and more.
It is also possible to score by more complex criteria. For instance, it is possible to find the list of hosts that contacted the largest number of unique hosts, or the list of countries that contacted your servers on the largest number of unique server ports.
As with the ftsq command, you must specify a FlowTraq Server to connect to, supply login details, select a timeframe and (optionally) specify a filter. And like ftsq, the results are returned in a formatted table, by default, or in CSV format (use either the -c option for CSV without a header, or the -c+ option for CSV with a header line). Please refer to the complete list of parameters in Section 3.4.2, “Retrieving Raw Session Data from the Command Line with ftsq”, Section 3.4.4, “Filter String Syntax” for more information on the filter language syntax, and Section 3.4.3, “Time Navigation” for information on timeframe specifications.
Where the usage of ftstat differs from that of ftsq is in specifying the desired statistic to calculate. Specify the statistic by using the -grp and -cnt paramaters:
Table 3.7. Statistical Query Parameters
| Parameter | Description |
|---|---|
-grp ENTITY_TYPE
| Create a ranking of the given entity type, one of: IP, IPPAIR, PORTPROTO, QOS, TCPFLAGS, IF, IFPAIR, COUNTRY, VLAN, VLANPAIR, ASN, ASNPAIR, MAC, or MACPAIR. |
-cnt COUNT
|
Rank entities on the specified field, one of:
|
| ftstat Example 1 |
|---|---|
To retrieve the top 25 hosts by bytes sent in the last week, use the following command: 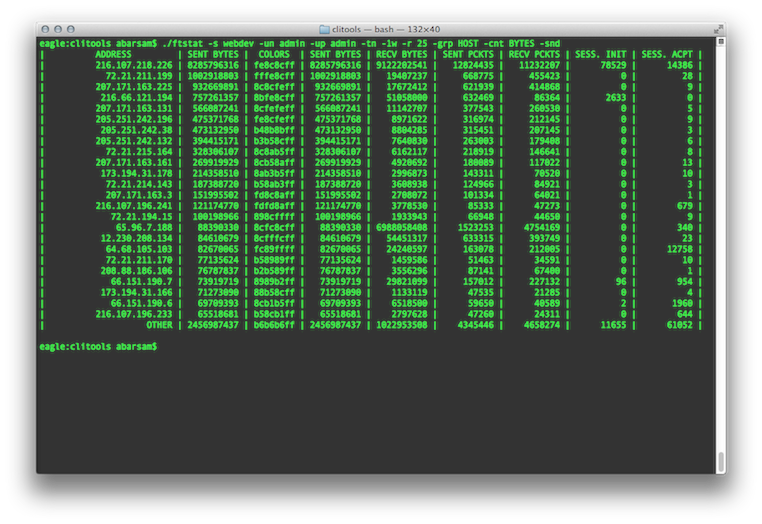 |
| ftstat Example 2 |
|---|---|
To retrieve the five host-pairs that communicated over the largest number of ports during last five hours, use the following command: 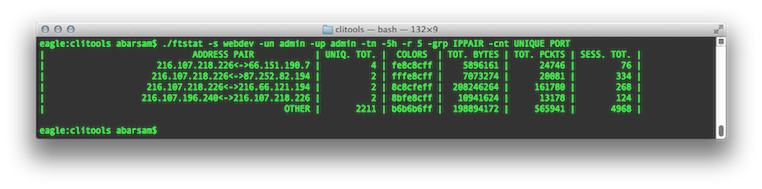 |
| Tip |
|---|---|
You may use the |
| Tip |
|---|---|
You may use the |
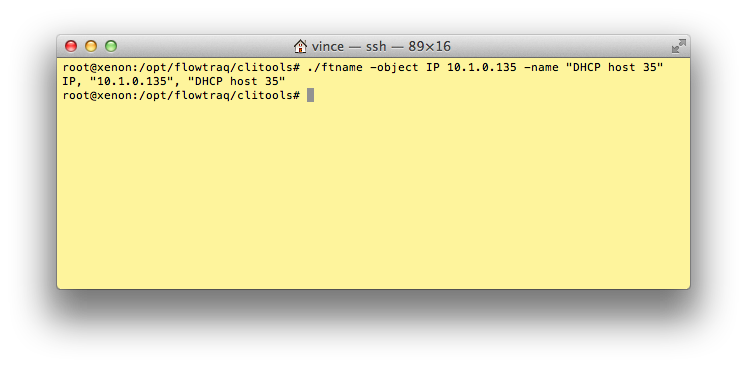
FlowTraq allows users to assign userfriendly names to a range of objects. These names can be used to quickly identify objects such as IP addresses, exporters, interfaces, etc. Some objects have built-in name resultion, such as Autonomous Systems (ASN). Names for ASN objects can be overridden by the user.
Names assigned by regular users are only visible to those users when an ftstat query is performed. Administrators have the option of specifying a -global parameter to the ftname command, which names the object for all users. The ftname command may also be used to query and list names that a user can see.
Table 3.8. Friendlyname Parameters
| Parameter | Description |
|---|---|
-object GT OBJ
|
Set or retrieve the name for an object of type |
-name NAME
|
Assign the given name of the specificed object. Requires the |
-global
|
Administrative users may set names that can be seen by all users by using this parameter. |
-nlist
|
List all known names. Optionally, this command takes an 'type' argument to restrict the listing to a particular object type only. Do not mix with an |
The ftsq command is also able to export flow records in IPFIX format on demand, using the switch:
-ipfix DESTINATION PORT
This can be appended to any other ftsq command that results in returned flow records. For example, to export the last 35 minutes of TCP/22 flows to the IPFIX destination 192.168.1.101:4739 (credentials omitted for clarity):
/opt/flowtraq/clitools/ftsq -tn -35m -q "(SRVPORT==22)&&(PROTO==TCP)" -ipfix 192.168.1.101 4739
The IPFIX output is not rate-limited; ftsq will generate flow records as quickly as it can. For very large numbers of flows, this may result in dropped packets or filled buffers on the receiving end, so it may be necessary to limit the number of flow records sent in this way.
It is also possible to use ftsq to fabricate flow records, for example from parsed log files or to test specific functionality. With the -read flag, ftsq will read lines from stdin, parse them, and output flow records. By default, it will export them to the command line; with the -ipfix switch, it will send parsed records to the selected destination. This is often useful when importing data into FlowTraq from a flow-like format, or to test security policies without actually simulating dangerous conditions (such denial of service attacks).
Parsed flow is accepted as a CSV-formatted line with the following columns:
Table 3.9. Flow record import format
| Parameter | Values |
|---|---|
| client ip | IP address (v4 or v6) |
| client port | Port number (0 - 65535; use 0 for protocols without ports) |
| server ip | IP address (v4 or v6) |
| server port | Port number (0 - 65535; use 0 for protocols without ports) |
| protocol | Protocol number or IANA name (e.g. 6 or "TCP") |
| client packets | Integer number of packets sent by client |
| client bytes | Integer number of octets sent by client |
| server packets | Integer number of packets sent by server |
| server bytes | Integer number of octets sent by server |
| start time | Timestamp of start of flow; format either 'MM/DD/YYYY HH:mm:ss.msecs' or 'seconds_since_epoch.msecs' |
| update time | Timestamp of this flow update; format either 'MM/DD/YYYY HH:mm:ss.msecs' or 'seconds_since_epoch.msecs' |
| exporter ip | IP address to use as exporting device address |
| application name | string describing application name (use 'unknown' in most applications) |
As an example, the following file describes two sessions:
            192.168.2.100, 12208, 8.8.8.8, 53, UDP, 1, 72, 1, 72, 5/31/2016 14:52:22.000000, 5/31/2016 14:52:23.426324, 192.168.2.1, dns
            192.168.2.100, 12209, 8.8.8.8, 53, UDP, 1, 73, 1, 133, 5/31/2016 14:52:23.123456, 5/31/2016 14:52:24.000000, 192.168.2.1, dns
This file can be read into ftsq -read, to view the resulting output:
# cat flows.txt | /opt/flowtraq/clitools/ftsq -read
Or with the following command to export the file's parsed records to 192.168.1.101:
# cat flows.txt | /opt/flowtraq/clitools/ftsq -read -ipfix 192.168.1.101 4739
The session key reauthentication mechanism allows for FlowTraq's command line tools to be easily integrated with third-party applications and applications hosted on other systems. The use of session keys allows automated scripts and script-based interfaces such as web GUIs to call additional command line tools without the need to store the username and password in a client-side cookie. Since the session key automatically expires, and is only valid from the originating IP address, it is unnecessary to perform an explicit "log out."
| Default Timeout 30 Minutes |
|---|---|
The FlowTraq server daemon times session keys out automatically after they have not been used for 30 minutes. Additionally, session keys will only be accepted from the IP address that generated the session key. To change this default behavior, please refer to the Administration Section of this manual. |
To create and use a session key, a command line tool must first provide a valid user's credentials to log into a session, and provide the -us parameter to request that a session key be created. Any command will work, but ftum is convenient because it doesn't need to interact with session data, so we use it in our example:
ftum -un USERNAME -up PASSWORD -us
If the credentials provided are valid, the stderr output of the command will be a session key; for example:
91389bd1127bce0a2615d390be08f696
The session key may subsequently used with the -us argument instead of a username/password combination to re-login to the same FlowTraq Server from the same IP address. Continuing our example:
ftstat -us 91389bd1127bce0a2615d390be08f696 [...]
| Tip |
|---|---|
Each time the session key is used, the timer is reset. The session key will eventually expire on the server side after the period of time specified in the |
The ftum command, in addition to managing individual user accounts, can be used to query the FlowTraq service for health information using the -info switch. The resulting output is a set of key/value pairs, such as this:
@local build_no="17022" release="Q1/16" mfgdate="1455886836" tsnow="1461332794.212263" tsboot="1460574802.312135" utcoff="-14400" nodename="flowtraq" ostype="Linux 3.2.0-4-amd64" architecture="x86_64 (64-bit)" numcpu="1" numslices="1" systemram="641372160" ramuse_cur="614200426" ramuse_max="481029120" ramfrac_base="86.048" ramfrac_cache="9.190" ramfrac_iomap="13.951" conntrack_size="16384" conntrack_use="15974" conntrack_active="8327" conntrack_fidelity="46852" cache_size="131072" cache_use="131072" cache_fidelity="410869" db_size="331942580" db_use="366030" db_fidelity="758070" db_earliest="1460487851" archive_size="0" archive_use="0" archive_fidelity="0" archive_earliest="0" input_flowrate_fps="1" lru_droprate_sps="0" max_queuefill="0.127%" max_cycletime_ms="0" max_archive_queuefill="0.000%" max_archive_cycletime_ms="0" max_inputfill="0.000%" max_writerate_sps="0" max_readrate_sps="0" target_readrate_sps="0" license_type="DEMO" license_end="1385823660" license_hash="0x9020e1b16080b1e"
Any individual items to be selected (instead of all items) can be requested in a comma-separated list as an argument to -info:
#root@flowtraq:/opt/flowtraq/clitools# ./ftum -un admin -info tsnow,tsboot
Password for admin login:
@local tsnow="1461332927.643921" tsboot="1460574802.312135"
The elements are broken down into four main catagories: install status, system profile, resource use, and flow rate.
The FlowTraq Install Status items detail the current FlowTraq parameters, including version information and license status:
-
release The currently-installed FlowTraq release, typically expressed as a Quarter and Year; e.g. "Q1/16"
-
build_no The build number of the currently-installed FlowTraq release. In some cases, the same release may have multiple build numbers, reflecting applied patches.
-
mfgdate The time stamp on which the release was generated.
-
license_type The currently installed license type. May be DEMO, EVAL, FULL, or SUBS[cription]. Note that DEMO licenses are severely limited on the number of flows they can consume. All nodes in a FlowTraq cluster should have the same license type.
-
license_end The expiration date for the currently-installed license.
-
license_hash The hashed value of the currently-installed license; can be used to monitor changes in installed licenses without storing actual keys.
The System Profile items detail the host on which this FlowTraq install is running, such as operating system, uptime, and other parameters:
-
tsnow Current system time in seconds since the UNIX epoch
-
tsboot Time of last system start in seconds since the UNIX epoch
-
utcoff UTC offset of current system timezone in seconds
-
nodename The hostname for this FlowTraq node
-
ostype The operating system type and version on which FlowTraq is installed.
-
architecture The processor architecture type on which FlowTraq is installed (typically "x86_64")
-
numcpu The number of CPU cores on this FlowTraq host
-
numslices The number of internal organization thread pools (internal variable)
-
systemram The amount of system RAM reported to FlowTraq
-
ramuse_cur Current RAM used by FlowTraq
-
ramuse_max Maxmimum RAM available for FlowTraq's use
-
ramfrac_base The fraction of the RAM used by FlowTraq that is devoted to the program itself and base operations (e.g. flow input, annotation tables, etc.)
-
ramfrac_cache The fraction of the RAM used by FlowTraq that is devoted to session caches. The larger this value is, the longer the cache fidelity will be.
-
ramfrac_iomap The fraction of the RAM used by FlowTraq that is devoted to IO and disk operations.
The cache items detail the state of this host's session caches on RAM and disk. This includes long-term settings and short-term values:
-
conntrack_size -
conntrack_use -
conntrack_active -
conntrack_fidelity -
cache_size -
cache_us -
cache_fidelity -
db_size -
db_use -
db_fidelity -
db_earliest -
archive_size -
archive_use -
archive_fidelity -
archive_earliest
The Flow Rate items provide details on the current flow rate, and on how this FlowTraq install is keeping pace with the incoming flows:
-
unput_flowrate_fps -
lru_droprate_sps -
max_queuefill -
max_cycletime_ms -
max_archive_queuefill -
max_archive_cycletime_ms -
max_inputfill -
max_writerate_sps -
max_readreate_sps -
target_readrate_sps
