
The default FlowTraq user interface is browser based and can be accessed by any Internet enabled device with a web browser. By default FlowTraq can be accessed through the /flowtraq subdirectory on the server. For details on FlowTraq server installation, refer to the Installation Manual.
In FlowTraq the Dashboard is the first page that loads upon login. A Dashboard is a customizable collection of widgets which automatically update their contents in real time. Each user can have several dashboards, each adapted to various purposes. For example:
You might have one Dashboard dedicated to showing an overview of the overall traffic on your network from various perspectives, for display on a "big-screen" in the Network Operations Center.
You might have another providing customer-centric views for starting investigations in response to incident reports.
You might have another focused on providing information about active alerts and mitigations, that you want to see on first login to drive your work flow.
Or you might have one or more combinations of the above.
You can customize your Dashboards in various ways.
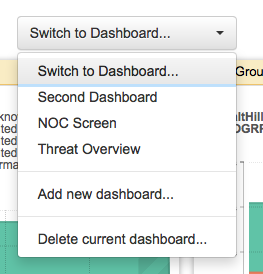
To create a new Dashboard, remove an existing Dashboard, or switch the currently-active Dashboard, use the dropdown menu at the top of the page:
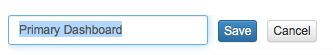
To rename a Dashboard, click the name of the Dashboard at the top:
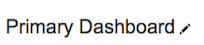
And enter a new name.
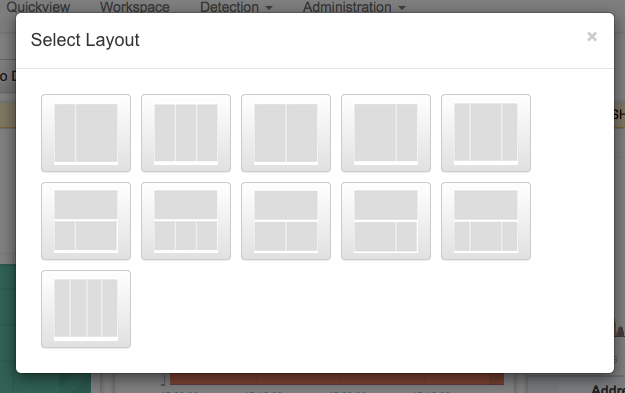
Use "Change Layout" button in the upper right corner to select from a menu of page layouts:
Use the "Add Widget" button in the upper right corner to add a Widget. Doing so will add a "generic" widget; select it the widget type to create it.
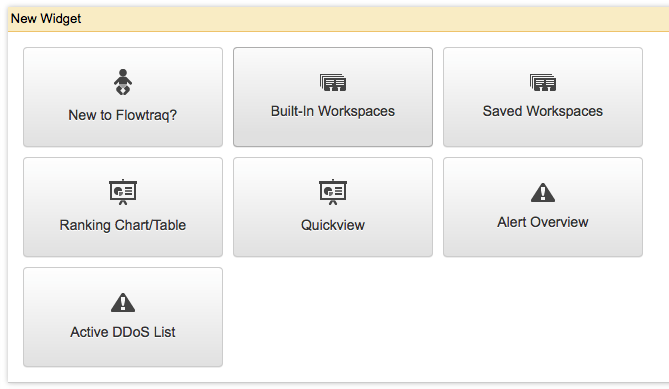
The following widget types are available.
- New to FlowTraq?
Provides advice on getting started with FlowTraq.
- Built-In Workspaces
Provides links to a number of pre-configured Workspaces to help you get acquainted with the Workspace.
- Saved Workspaces
Stores Workspaces you have customized and chosen to save, for quick reference.
- Ranking Chart/Table
Provides a chart and/or table corresponding to a Workspace configuration, with a timeframe relative-to-now. This widget is driven by forensic queries, but due to the load time constraints of the Dashboard, they run RAM-only queries. Use this widget to always have a view of important, recent network activity.
- Quickview
Similar to "Ranking Chart/Table", but this time of a preconfigured Quickview. Use this to add charts and tables of longer-term network traffic.
- Alert Overview
Display an overview of ongoing alerts by Severity.
- Active DDoS List
Provides an overview on ongoing DDoS alerts and gives you the oppotunity to mitigate them (if you have a mitigation plugin installed.)
Some widgets can be further configured. Click the "wrench" icon in the widget's title bar to configure it.
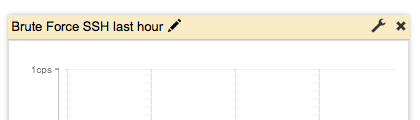
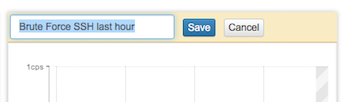
Some widgets can be renamed, which is indicated by a "pencil" displayed next to the widget title when it is hovered. Click the pencil or the title text to change the widget's title:
In FlowTraq the Workspace is your interactive analysis window into the traffic on your network. The Workspace features a powerful filtering interface that enables the analyst to select precisely the traffic of interest. Combined with hundreds of possible viewing combinations, the analyst can observe events on the network from any viewing angle, identifying patterns that remain hidden in traditional network analysis tools. By selecting objects the analyst can quickly pivot, zoom, and focus on suspicious activity, data breaches, and performance issues.
FlowTraq redefines traffic reporting by featuring a full-fidelity database that retains all flow records indefinitely. This means you can generate any view of your network, using any arbitrary filter, for any desired timeframe, whenever you need. With FlowTraq it is not necessary to define today what you want to analyze tomorrow, as all reports can be generated on the fly, post-hoc. Since all workspaces are defined in the URL, you can save interesting views of your traffic by bookmarking the URL. Additionally, since each view is generated dynamically, FlowTraq offers arbitrary zoom-in capability with full precision at any timescale.
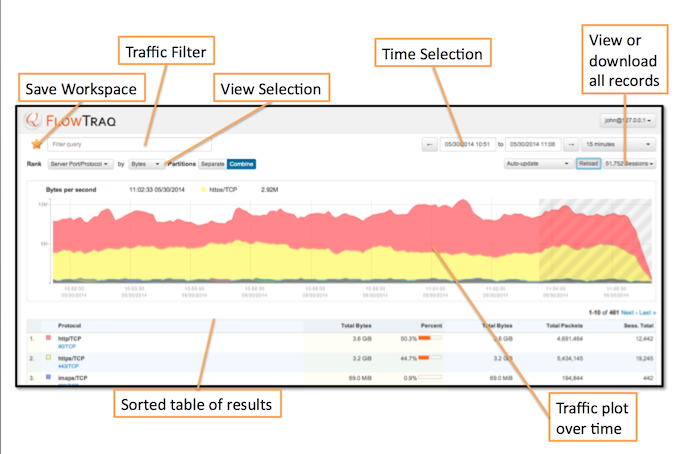
The FlowTraq workspace has three components:
An interactive graph showing the selected view of the selected traffic in the selected time window.
A table detailing each of the elements shown in the graph.
A full set of navigation tools for time selection, filtering, and viewing.
The Workspace graph is an interactive display of the overall traffic in the given time frame selected by the filter and formatted according to the desired view and ranking. Each graph contains two primary interactive elements: hovering over any item in view gives an estimate at the top of the graph of instantaneous rate; clicking and dragging in the window allows simple time selection within the frame.
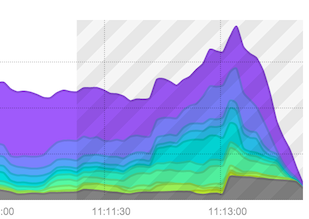
Time frames showing very recent data may have a gray-striped overlay, as shown below. Flow data is being continually reported, generally by UDP and at irregular rates, and so it is important to remember that very recent data is subject to change as new reports come in filling in details over the last minutes. The gray area is primarily a reminder to exercise caution when using very recent values.
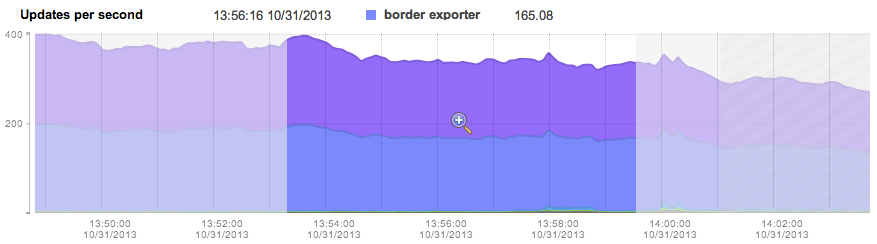
When displaying a graph the analyst may select an area of data to zoom in on by dragging the cursor over a section of the graph. When the desired zoom area is selected, a magnifying glass icon will appear. Clicking the icon will re-run the current view and filter on the selected timeframe:
The table in the workspace view will display the first 10 top items. Additional pages with further ranking are available by simply navigating to the next page with the buttons at the bottom right of each table. As the analyst moves through the various pages the graph will change to indicate which data the table is displaying. The workspace displays a top-N style ranking, so each additional data page will have a subsequently smaller contribution to the overall total.
The number and type of table columns varies in part by the selected view, but the following types will always be shown:
- Rank
The numerical rank of the current row according to the viewing criteria. The top row, #1, represents the largest-count entity in the list.
- Color
Each page is shown in the workspace graph by a band of colors with gray bands above and below. Each row shown on the current page of the table is represented in the graph by the color in this column.
- Entity (name varies)
Depending on the rank criteria, this column may be IP address, port/protocol, autonomous system number, or other element or groups of elements. Many of these groupings have their own names, such as Service Enpoint, denoting an IP address and server port/protocol combination.
- Partition (main partition only)
When viewing multiple partitions' worth of data, FlowTraq optional breaks down each item according to the partition to which it belongs. This may result in multiple entries for the same entity: for example, ranking top countries by bytes and separating by partition may result in two or three entries for the United States, each with its own separate totals.
- Total Count and Percent
The ranking portion of the view is a countable number, such as bytes, packets, or unique IPs. These columns show the count for this entity over the entire time frame and the percent of the total count represented by this entity.
- Peak Rate
This column is paired with the total count, showing the highest estimated rate during the time frame shown. Rate estimates may vary by window width, especially for very short-duration sessions.
- Average Rate
Along with Total Count and Peak Rate, Average Rate depends on the counting criteria. It is the average non-zero rate observed during the time frame shown: periods in which no communication from the given host are observed are not included in the averaging calculation.
- Bytes, Packets, and Session counts
Regardless of the selected count, volume estimates are shown for each entity for the time frame selected. Usually, these are total volume sent and received, but depending on view parameters may be broken down by sent and received
- 95th Percentile
This column shows an estimate of the non-zero 95th percentile count for the entity shown. This measure is useful in comparison to peak and average to get a sense of how sustained the maximum rates are, and is calculated by selecting the 95th-highest non-zero count in the shown window.
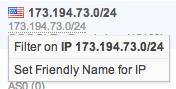
Each entity shown in blue type (typically the ranked entity, but also the Partition number where shown and derived fields such as autonomous system number and country for IP address entities) has its own context menu. The menu, which can be customized, contains further actions specific to the entity clicked, including tagging ranked items with userfriendly names, adding ranked items to the filter to quickly pivot the view, and further customizations.
Using the same item menu it is possible to add objects to your current filter, and either focus on their traffic, or ignore it. Keep in mind that a 'match-all' filter combination should be used when working with an existing filter. In pairwise rankings it is possible add either side of the pairing to the filter.
Some items may offer additional filters. IP address items, for instance, will also offer the ability to filter on the autonomous system that the IP address resides in. Adding an exporter to a filter will create two filter boxes: one for the exporter IP, and one for the export protocol version.
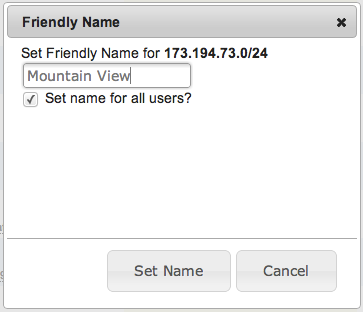
For operator convenience FlowTraq enables the analyst to tag certain items in the ranked view table with userfriendly names. Click on the item and select 'Set Friendly Name' to set or change the display name of the item. Administrative users have the additional option to set the name for all the users. When this option is selected all users will see the name that the administrative user has assigned unless the user themselves have assigned their own friendly name to the same item. Primary ranked objects that may be tagged with a userfriendly name:
IP address (including the addresses in IP-pair and Service Endpoint views)
NetBlocks
Traffic Groups
Autonomous Systems (overrides their resolved name)
Server Port/Protocol combinations (including those in the Service Endpoint views)
QoS values
VLANs
Exporter/Interface combinations
By default IP addresses and autonomous system names are reverse-resolved unless a friendly name was assigned. IP addresses are reverse resolved through DNS, while AS numbers are reverse resolved in the FlowTraq server.
Select 'Set Friendly Name' to set or change the display name of the item:
In addition to friendly names and click-to-filter, users can add a variety of customized links to the table menu. Links appear according to the matched patterns in their URLs: a link that takes an IP address, for example, will only be listed in the context menus for IPs, IP pairs, service endpoints, etc. As an example, a menu item containing the link http://www.google.com/search?q=%IP% will appear in the menus for items containing IP addresses, and will fill in those addresses automatically.
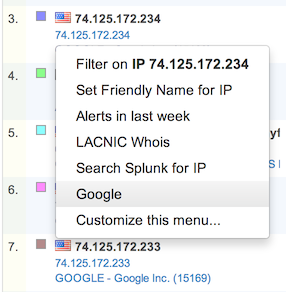
To access the menu customization page, right-click on any object in the FlowTraq workspace table and select 'Customize this menu...'. At the top of the customization page is a button to Add Custom Menu Item
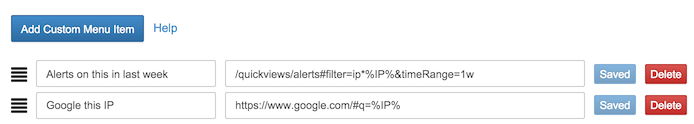
Menu items may contain the following shortcuts, which are used both to determine whether a URL is put in a given object's context menu, and are filled in to create the final URL.
- %IP%
IP address, either IPv4 or IPv6
- %PORT%
Port number
- %ASN%
Autonomous system number
- %TE%
Earliest time in window, in UNIX (seconds since epoch) format
- %TL%
Latest time in window, in UNIX (seconds since epoch) format
All menus will match against the TE and TL shortcuts according to the currently-shown time window. Menu items are added on a per-user basis, meaning that each user configures their own menus.
FlowTraq traffic navigation is defined by 3 key elements:
A filter selecting what traffic is to be ranked. The filter may define exporters, address ranges, protocols, etc.
A ranking view selects how traffic is to be ranked and displayed. Examples of rankings include top addresses by packet count, top exporters by update count, application by total connections, etc. Ranking by an item in an 'Any' filter will focus the view on the contents of that filter.

A timeframe selects traffic in the time interval traffic is to be ranked. Timeframes can be specified in the absolute (date and time), or relative to now (last 3 hours).

Thanks to the full fidelity nature of the FlowTraq database every field of the session record can be filtered on. This includes derived fields such as country and autonomous system number, which are not found in the flow export records, and added by FlowTraq. Since FlowTraq re-assembles uni-directional flows back into bi-directional sessions, many filter options have both a client and a server side, such as ports, traffic groups, and byte/packet counts. FlowTraq also tracks the sender and receiver of data, in order to differentiate direction of data flow.
![[Note]](../common/images/admon/note.png) | Note |
|---|---|
The differentiation between clients, server, senders, and receivers can be subtle. As an example, when host A connects to host B and requests a download of data, then host A is the client and receiver, and host B is the server and sender. If host A connects to host B and initiates an upload of data to B, however, host A is still the client and B the server, but A is now the sender and B the receiver. In most connections each host will both send and receive some data; filtering on sender or receiver will focus on the data flow when returning results. |
A filter selects which session records will be used to perform the ranking. This means that the filter is applied to each session record in the selected timeframe to decide if the record should be returned and included.
![[Important]](../common/images/admon/important.png) | Important |
|---|---|
Complex filters can be constructed by entering multiple values in a filter line, or by combining multiple filter lines: When entering multiple values in a single filter line they are combined through a logical 'OR' operation, meaning they will use a match any approach. Multiple filter lines can be combined through a match all (logical 'AND') or match any (logical 'OR') approach. |
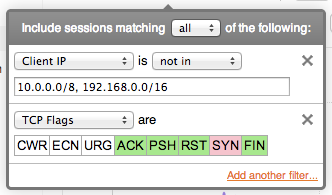
FlowTraq filtering supports definitions of CIDR (classless interdomain routing) blocks in both IPv4 (32-bit addresses) and IPv6 (128-bit addresses). By using the 'slash-size' subnet mask notation, addresses in the entire range are matched. When specifying multiple CIDR blocks, the comma acts as a logical 'OR' in a positive match:
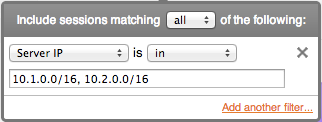
SRVIP==10.1.0.0/16 || SRVIP==10.2.0.0/16
Selecting 'not in' transforms the meaning to a logical 'AND' and negates the match:
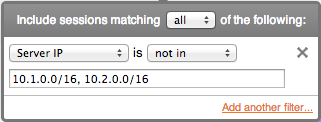
SRVIP!=10.1.0.0/16 && SRVIP!=10.2.0.0/16
FlowTraq supports matching specifically the 'client' or the 'server' side of a session for entities such as IP addresses, ports, autonomous systems, or interface index numbers. For example, this means the analyst can specifically choose to only select sessions where a particular address acts as a server (receiving the connection). When choosing 'either address', all sessions where either the server or the client address match the selected block will be included.
| Important |
|---|---|
When filtering on 'either' only matching entities are ranked. Example: either ASN==32934 will only show FaceBook in the ASN-view, and FaceBook peers in the ASNPAIR-view. When filtering on 'client' or 'server' side entities, all entities in the record are ranked. Example: SRVIP==10.0.1.10 will only any IP that communicated with 10.0.1.10 (including the server itself) in an IP-view |
There are many cases where the directionality of data flow is concern; questions of "who is sending data to my network" and "who outside my network is consuming my data" require knowing not only which host is initiating a connection but also which host is consuming data. Sometimes this can be discerned from protocol: the client initiates a connection and then always downloads data, or always uploads data. UDP streams, for example, are highly directional in this way, and identifying the client and server is sufficient to determine the flow of data. A filter on Server IP, then, identifies the consumer of NetFlow data.
However, many common protocols vary from session to session. SSH in particular can be either a pure upload, pure download, or an interactive session with meaningful data going both ways. Filtering on Sending IP identifies and then ranks sessions according to the data they transmit, regardless of whether that host (or VLAN, ASN, or Country) initiated the connection.
In combination with the INT filter element (marking all IP addresses that are internal to the partition), this type of filtering can be a fast and effective way to identify the top external consumers of your data.
| Important |
|---|---|
Remember that in most protocols, some data is sent each way: providing passwords before a download, for example, or a connection keep-alive. Very long downloads can result in the appearance of modest-sized uploads in the opposite direction. When investigating potential data exfiltration, always check the other half of the traffic to get a clear picture. |
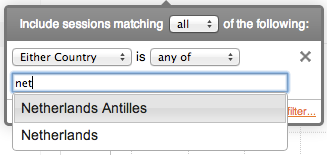
Traffic groups and countries can only be filtered by their name. Simply start typing and they will auto-complete. Application name filtering is also performed by name, but does not support auto-complete.
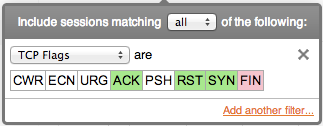
TCP flags are filtered by selecting which flags should be included (green), excluded (red), and don't-care (white). Click a flag multiple times to change the include/exclude status.
Flow duration is computed from start and end times, and the filter is interpreted as duration in seconds. However: sessions are never longer than the value of the 'toolong' parameter (default is 8 hours maximum).
- IP Address
- Sending IP
Filter on hosts or CIDR blocks SENDING data, regardless of connection initiator. Changes view to order by data flow.
- Receiving IP
Filter on hosts or CIDR blocks RECEIVING data, regardless of connection initiator. Changes view to order by data flow.
- Client IP
Filter on hosts or CIDR blocks that INITIATE connections.
- Server IP
Filter on hosts or CIDR blocks that ACCEPT connections.
- Any IP
Filter on hosts or CIDR blocks listed in connections. View will only show hosts that match items in this filter.
- Exporter
- Exporter IP
The IP address of the exporting device (note that if your flows are being repeated by proxy or duplication software that this may be the address of the repeater)
- Exporter Version
Numerical value of NetFlow version used (v5 is 5, v9 is 9, IPFIX is 10)
- Sample Rate
Where applicable, show flows that are sampled at the given rate 1:RATE. (Non-sampled flows will appear for SAMPRATE==1)
- Updates
Select sessions with the given number of updates. This is useful for gauging the effect of exporter parameter changes on FlowTraq load.
- Interface Number
- Sending Interface
Filter (and view) sessions according to the device interface(s) transmitting data.
- Receiving Interface
Filter (and view) sessions according to the device interface(s) receiving data.
- Interface In
Show sessions with the selected Ingress interface(s).
- Interface Out
Show sessions with the selected Egress interface(s)
- Any Interface
Show all sessions tagged with the selected interface (both Ingress and Egress) If viewing by interfaces, only show the selected interface(s).
- Port
- Sending Port
Filter on port(s) from which data is sent (similar to
Sending IP)- Receiving Port
Filter on port(s) to which data is sent (similar to
Receiving IP)- Client Port
Filter on client or source port (the port used by the initiator of the conversation)
- Server Port
Filter on server or destination port (the port used by the contacted host; usually a standard port)
- Any Port
Filter on any port listed. Does not affect view ranking.
- Protocol
- Protocol
IP protocol, numbered according to IANA definitions.
- Application
- Application
Application name, for those devices exporting application identification based on deep packet inspection (e.g. NBAR)
- Country of Origin
- Sending Country
Filter on identified country sending data (as determined by IANA IP space allocation)
- Receiving Country
Filter on identified country receiving data.
- Client Country
Filter on country of initiating IP address (as determined by IANA IP space allocation)
- Server Country
Filter on country of server IP address (as determined by IANA IP space allocation)
- Any Country
Filter on either country in communications.
- Session Volume
- Sent Bytes
Filter sessions according to bytes sent -- best match according to either client or server half of conversation; used in conjunction with "Sending IP" and "Sending Port" filters. (Note that there is no corresponding "Received Bytes") Includes greater than/less than and range operators.
- Client Bytes
Filter sessions according to bytes sent by the Client (initiator). Includes greater than/less than and range operators.
- Server Bytes
Filter sessions according to bytes sent by the Server (to the initiator). Includes greater than/less than operators.
- Any Bytes
Filter sessions according to bytes sent -- best match according to either client or server half of conversation; ignores "Sending IP" and "Sending Port" filters. Includes greater than/less than and range operators.
- Total Bytes
Filter sessions according to the total bytes sent by either host. Includes greater than/less than and range operators.
- Sent Packets
Filter sessions according to number of packets sent -- best match according to either client or server half of conversation; used in conjunction with "Sending IP" and "Sending Port" filters. (Note that there is no corresponding "Received Packets") Includes greater than/less than and range operators.
- Client Packets
Filter sessions according to number of packets sent by the Client (initiator). Includes greater than/less than and range operators.
- Server Packets
Filter sessions according to packets sent by the Server (to the initiator). Includes greater than/less than operators.
- Any Packets
Filter sessions according to packets sent by either host -- best match according to either client or server half of conversation; ignores "Sending IP" and "Sending Port" filters. Includes greater than/less than and range operators.
- Total Packets
Filter sessions according to the total packets sent by either host. Includes greater than/less than and range operators.
- TCP
- TCP Flags
Filter according to TCP flag pattern (See 'Special Filters' section below)
- IP
- ToS/DiffServ
Filter according to the full DiffServ field, if present. If you desire to filter on QoS (the higher-order bits) remember to convert before searching. Includes greater than/less than and range operators.
- Timing
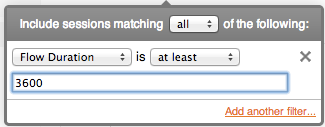
- Flow Duration
Filter according to session duration in seconds. Note that very long-running sessions or sessions with long intervals between packets may be split by the exporter or by FlowTraq in order to preserve performance.
- MAC Address
- Sending MAC
Filter on MAC address sending traffic, regardless of session initiator.
- Receiving MAC
Filter on MAC address receiving traffic, regardless of session initiator. MAC addresses are not always available: some routers do not record this information, or substitute last hop and next hop for client and server. External MAC addresses are rarely available.
- Client MAC
Filter on MAC address initiating the session.
- Server MAC
Filter on MAC address of the destination host.
- Any MAC
Filter on any sessions containing selected MAC address(es).
- Traffic Group
- Sending Traffic Group
Filter on traffic group sending data, regardless of session initiator. (See 'Special Filters' section below)
- Receiving Traffic Group
Filter on traffic group(s) receiving data, regardless of session initator. (See 'Special Filters' section below)
- Client Traffic Group
Filter on traffic group(s) initiating session. (See 'Special Filters' section below)
- Server Traffic Group
Filter on destination traffic group(s). (See 'Special Filters' section below)
- Any Traffic Group
Filter all sessions containing selected traffic group(s). (See 'Special Filters' section below)
- VLAN Number
- Sending VLAN
Filter on VLAN sending data, regardless of session initiator.
- Receiving VLAN
Filter on VLAN receiving data, regardless of session initiator.
- Client VLAN
Filter on VLAN initiating sessions.
- Server VLAN
Filter on destination VLAN.
- Any VLAN
Filter on sessions containing selected VLAN(s) as either source or destination.
- AS Number
- Sending AS
Filter on traffic sent by selected Autonomous Systems, identified by number.
- Receiving AS
Filter on traffic received by selected Autonomous Systems, identified by number.
- Client AS
Filter on source Autonomous System by number.
- Server AS
Filter on destination Autonomous System by number.
- Any AS
Filter on all traffic involving selected Autonomous System.
- ASA Firewall Event
- NSEL Event
Filter on events by ASA event ID. (1= Flow created, 2= Flow deleted, 3= Flow denied)
- NSEL Ext. ID
Filter on ASA extended events, detailing reason for flow-denied events (1001-1004)
- Partition
- Partition
Select sessions by partition number. Note that only users in Partition 0 can see traffic from multiple partitions.
FlowTraq supports a system where the analyst can create arbitrary top-N rankings for any entity found in the session record. A view is created by selecting which entity (such as IP address, netblock, ASN, ...) should be ranked based on what quantity (packets, bytes, connections, ...). Some selections allow the analyst to specify whether only sent, or only received quantities should be included. This example shows a workspace with IP addresses ranked by bits sent. The graph displays the progression of bits sent over time by each of the top IP addresses by color code:
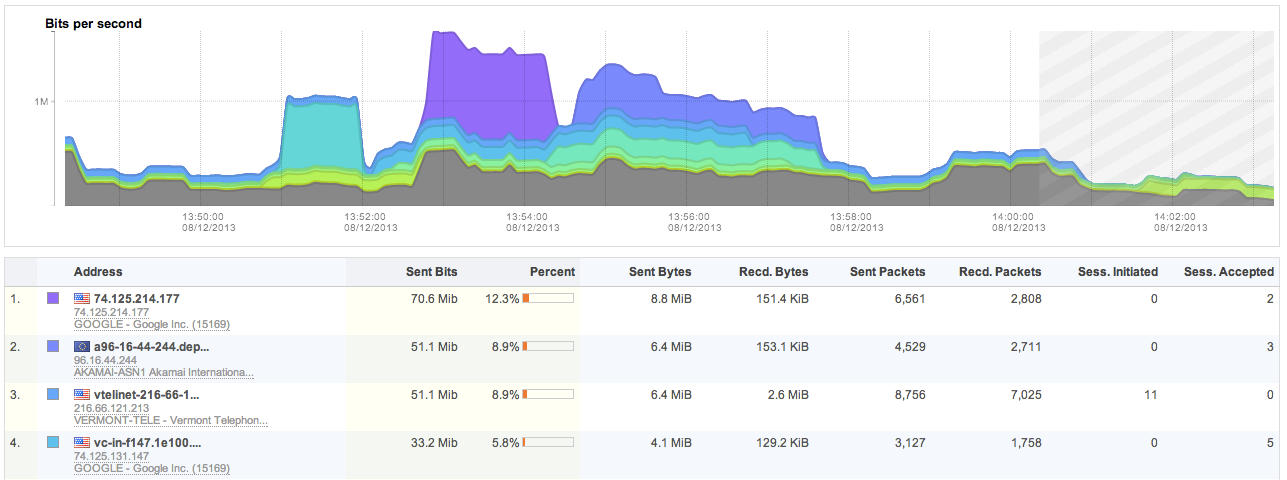
The first column of the table shows the top IP addresses with their reverse-resolved name (if available), and the autonomous system in which the IP address resides. The ranking was performed on bits sent by each IP address. The percentage column displays the contribution of each entity for the total selected traffic based on the filter and current timeframe. The additional columns are auxilary information and cannot be used for sorting.
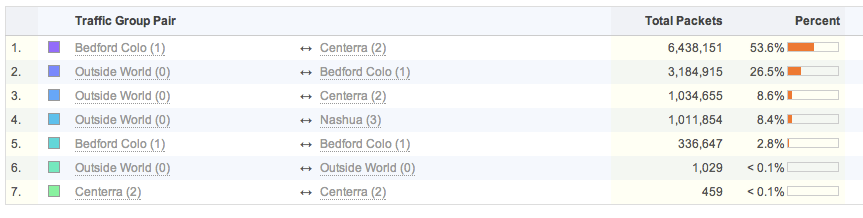
FlowTraq re-assembles uni-directional flows into bi-directional sessions, allowing some entities to be grouped in a pair-wise fashion. IP addresses, interface index numbers, VLAN identifiers, autonomous systems, traffic groups, and MAC addresses can all be ranked in pairwise views. The example image below shows total packets sent between the various FlowTraq office locations and the outside world based on the defined traffic groups:
Ranking of entities can be further controlled to only include bits/bytes/packets/sessions sent, or received. By default both sent and received counts are added into the ranking. By selecting 'sent' or 'received' the analyst is able to control the behavior of the ranking to include include the selected count to or from each entity.
| Important |
|---|---|
Sent/Received differentiation is only available for entities that CAN be viewed in a pairwise fashion, although a pairwise view does not need to be selected. In other words, only entities that are present at each side of a communication (such as IP addresses, autonomous systems, traffic groups, ...) have a meaningful differentiation between bytes/bits/packets sent or received. When viewing accumulated TCP flags, for example, the directionality is meaninless as TCP flags are a property of the communication, and are not tied to either side of the communication. |
FlowTraq offers a wide variety of primary rankings. Some of these are derived from multiple fields in the session record, others are derived from FlowTraq tagged fields:
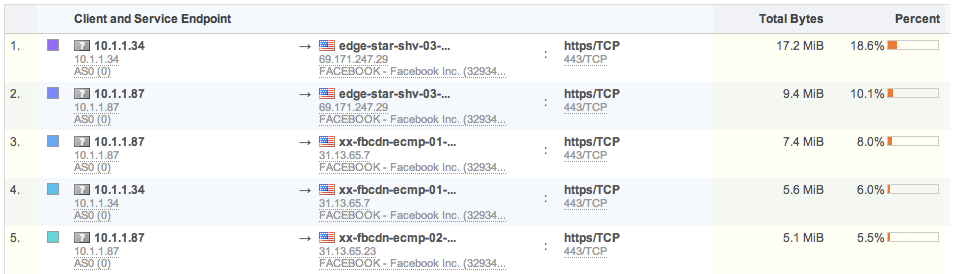
Service Endpoint views: Powerful view combining either server IP and server port/protocol, or client and server IP and server port/protocol. It quickly shows usage of various services in and outside of your network:
Autonomous System views: FlowTraq automatically tags each IP address with the appropriate autonomous system that it belongs to. The ASN views give a high-level macro view of traffic flowing through your network, and common service destinations. Registered names for AS numbers are included and presented in the FlowTraq interface:
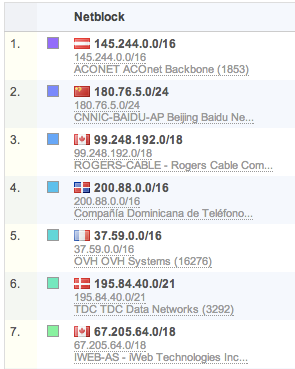
NetBlock views: Similar to AS tagging, each IP address is also tagged with the size of the network CIDR block it resides in. Often this information is available from the exporter. If not, FlowTraq will use the size of the advertised AS block that the IP address is part of. NetBlock views offer another good macro view of traffic patterns.
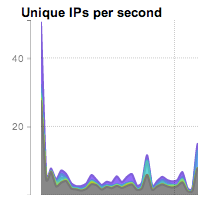
In addition to regular quantity counts, FlowTraq is also capable of ranking by the unique occurences of other entities. These views only consider the number of uniquely different entities were observed, session and packet counts are therefore irrelevant. Examples:
IP addresses ranked by unique IP peers: ranks each IP address based on the number of unique other IP addresses it communicated with.
Ports by unique TCP flags: ranks each server port by the number of different TCP flag combinates observed.
IP address by unique server port: ranks each IP address by the number of different server ports it has contacted.
Many different combinations are possible. Unique count views can quickly find scanning and reconnaissance behavior (IP by unique port), and worm spreading and SPAM behavior (IP by unique IP). Note that graphs will usually show an initial spike as the count is performed on first occurrence. This is normal and expected:
FlowTraq is able to offer arbitrary time navigation because data is never aggregated. A history of the most recently received records is kept in RAM for quick query processing. Historical queries are serviced from the disk database, and may take longer to complete.
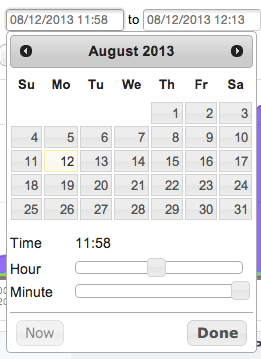
The time navigation bar in the workspace allows for absolute time selection by selecting exact dates and times, as well as relative time selection where the analyst can choose to quickly view the last N minutes or hours. Click on either of the date/time fields to display a calendar widget to select a specific time and date for selecting the timeframe of your query:
Select a data and time using the calendar and the sliders, and click Done when finished:
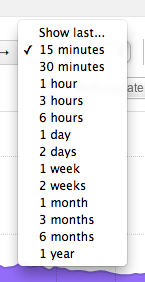
Relative time selection offers the analyst the option to quickly select a timeframe in the recent past up to now. By default the workspace displays a 15 minute view of your network:
After selecting the desired timeframe through absolute or relative time the view can be refreshed by selecting the Apply button at the top right of the workspace.
The time navigation bar displays the timestamps enclosing the currently displayed data. On either side of these timestamps are buttons to quickly move to the previous, or next timesegment of the same length as currently displayed. These Forward/Backward buttons allow the analyst to quickly navigate through the data by viewing the previous or next timeslice with the same view and filter.
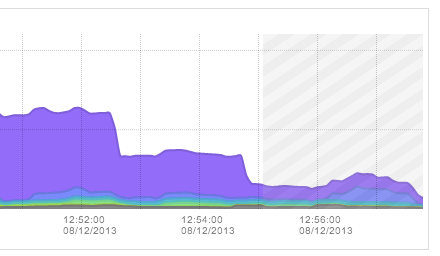
When navigating to a timeframe that includes the current time, or any future time, a crosshatch area will be drawn on the graph indicating the traffic records are yet to be received. The crosshatch area starts at approximately T-2 minutes, indicating that exporters may not yet have reported all traffic records for the most recent timeframe:
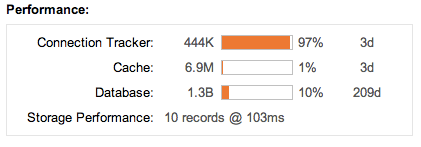
FlowTraq keeps a cache of the most recently received traffic records in RAM memory to facilitate rapid processing of queries in the most recent timeframes where analysts are most likely to be doing interactive work. For timeframes further back in history FlowTraq will query the disk database, which may take substantially longer than a RAM based query. The period for which RAM based queries can be performed is strongly dependent on the inflow rate of flow updates, and the amount of RAM dedicated to the FlowTraq system.
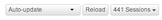
During query processing the icon below the process bar will indicate if the query is being serviced from RAM or from disk:

To analyze how much data is currently held in RAM and how resources are being used please refer to the administration page. The Performance widget displays the current RAM Cache fill (1% below) and the period for which queries can be serviced from RAM (3 days below):
The filtering options produce a list of sessions that underlie the displayed graphs. These sessions can be viewed directly by selecting the sessions dropdown next to the Reload button and selecting View.
The session list includes all session records that overlap the selected time frame (rather than only sessions that fall entirely within the time selection) and that match the filter (if any). The list is unaffected by the Rank criteria.
| Important |
|---|---|
Retrieving the session list is a separate query (in order to free up internal resources for other users, FlowTraq does not cache query results), and so changes to the filter or time frame will be reflected in the list of returned sessions, even if not yet applied to the current workspace. |
