
![[Caution]](../common/images/admon/caution.png) | Caution |
|---|---|
The Java-based FlowTraq desktop client is provided only for historical reasons. New feature developments in the FlowTraq user interface are focussed only on the HTML5 web client. It is therefore possible that some key features are not available in the desktop client. |
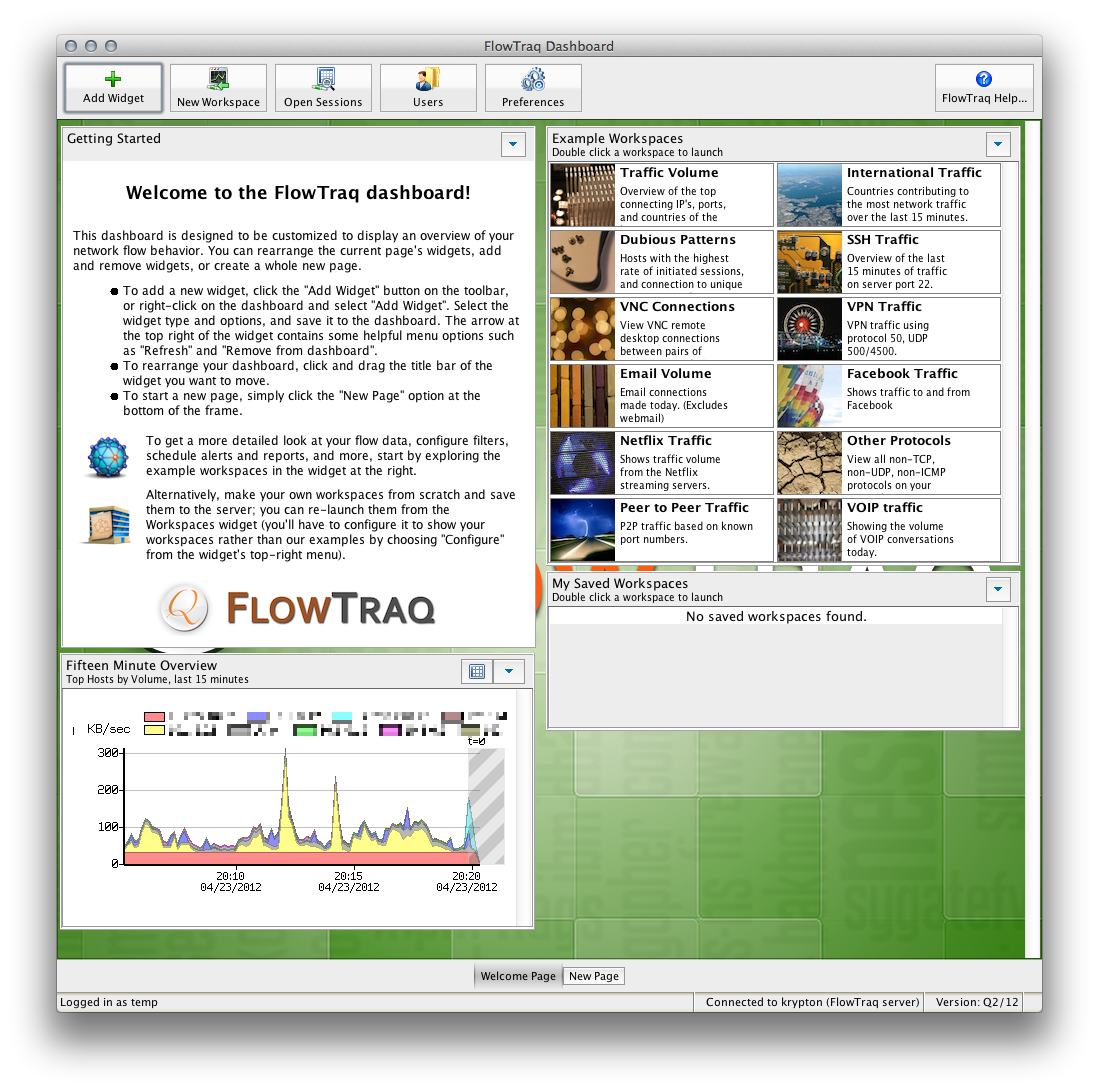
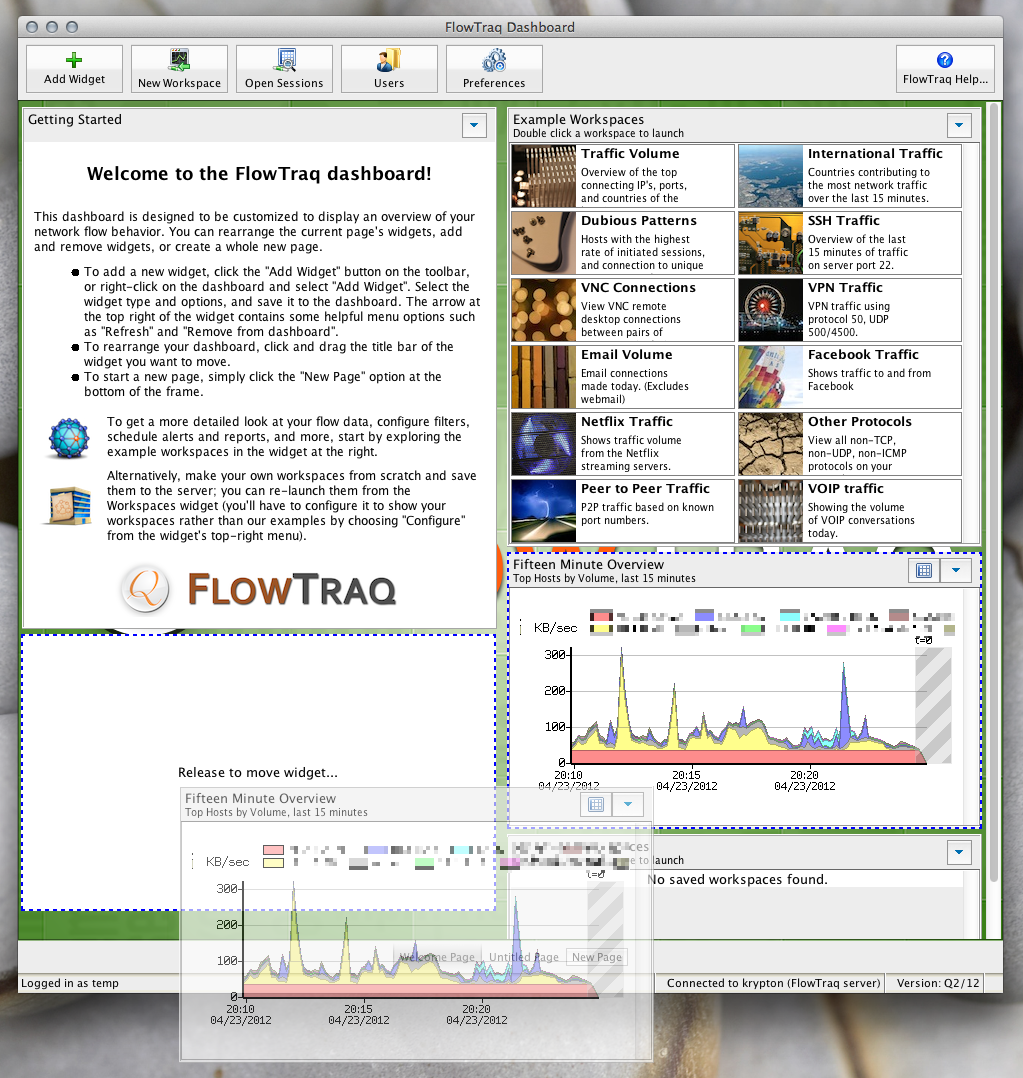
The Dashboard is the first window you see when you log in to the FlowTraq Java desktop client. It has several functions:
It provides a customizable, at-a-glance overview of the activity on your network.
It is the launching point for conducting deeper investigations in Workspaces (see Section 3.3.2, “Interactive Reports (Workspaces)”) or the Session Explorer (see Section 3.3.3, “Session Explorer”), and for resuming investigations-in-progress.
It provides access to the contents of scheduled Reports (see Section 3.3.4, “Scheduled Reports”) and the list of Alert notifications (see Section 3.3.5, “Alerts and Notifications”) .
It provides access to the user-specific preference panels.
For administrative users, it provides access to the system-wide preference control panels, as well as the user administration control panel.
This chapter describes the Dashboard in depth.
The first time a user logs in, that user's Dashboard is pre-set to include a few widgets, including a "Welcome" message, a Workspaces widget showing some preconfigured Workspaces, an (initially empty) Workspaces widget which provides access to Workspaces you save, and a few other informational widgets.
![[Important]](../common/images/admon/important.png) | Important |
|---|---|
Your dashboard is your Dashboard. Each FlowTraq user can customize their own Dashboard to their specifications. We do not recommend sharing user profiles or logging in from multiple locations at the same time, as user data sychronization issues can occur. There are no limitations on the number of user accounts you can configure, so please configure one user for each person in your organization who will be using FlowTraq. |
Initially, the Dashboard only has one page. Pages can be added, removed, renamed, and rearraged in the following ways:
To add a page, click the "New Page" button at the bottom of the Dashboard window.
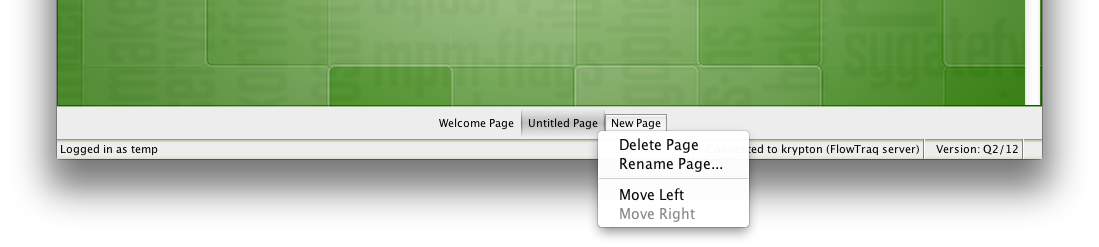
To remove, rename, or move an existing page, right-click on the name of the page and select the appropriate option.
![[Tip]](../common/images/admon/tip.png) | Multi-column Layout |
|---|---|
Each page can have two, three, or four columns of widgets. To change the number of columns a page has, right-click on the name of the page and select the "Two Columns", "Three Columns", or "Four Columns".  |
Widgets can be added, removed, rearranged, and configured in a variety of ways to give insight into the information most pertinent to your needs.
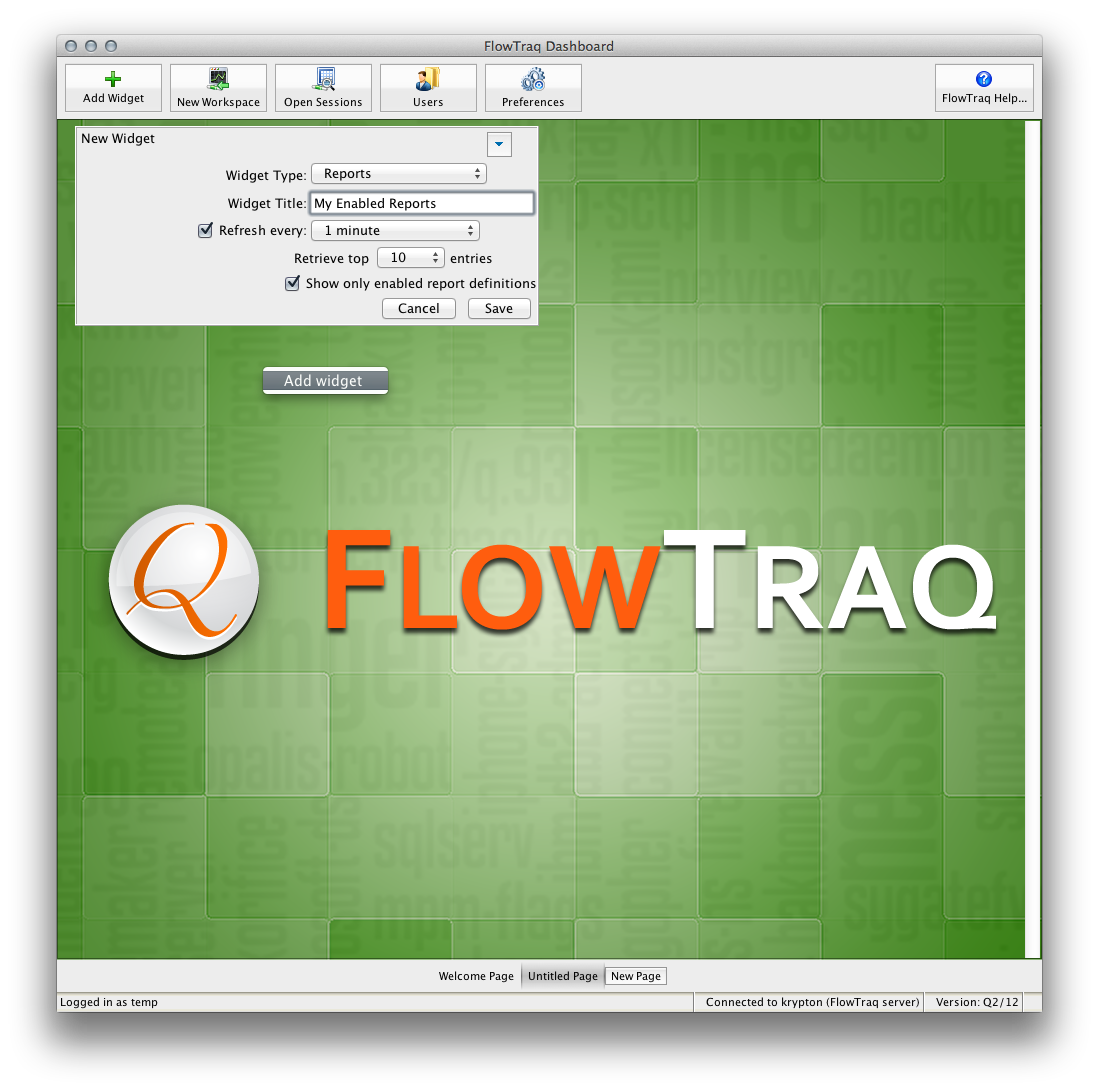
To add a widget, click the "Add Widget" button on the Dashboard Toolbar, or right-click on some empty space in the Dashboard and select "Add Widget." An unconfigured widget will appear. Complete the widget configuration by naming the widget, selecting the widget type from the dropdown, choosing an automatic refresh interval, and completing the rest of the widget's configuration. Finally, click "Save", and the new widget will appear.
To remove a widget, right-click on the widget menu button, which is located on the right-hand side of the widget's title bar, and select "Remove Widget."
Important 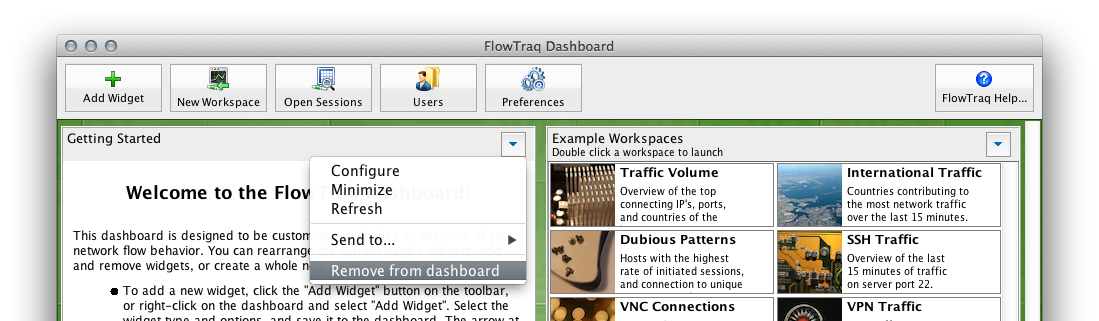
You cannot undo this action.
To move a widget to another location on the same Dashboard page, drag its title bar to where you would like to move it. A "landing-zone" will appear in the spot where the widget will be moved. Release the mouse over the landing zone and the widget will be moved.
To move a widget to another Dashboard page, right-click on the widget menu button, which is located on the right-hand side of the widget's title bar, and select "Send to Page > Page Name". (Note: You may have to create an additional Dashboard page first.)
To change a widget's configuration (including widget type), right-click on the widget menu button, which is located on the right-hand side of the widget's title bar, and select "Configure".
The FlowTraq Java desktop client has several types of widgets. In alphabetical order, they are:
- Alerts
The Alerts widget provides an interface to FlowTraq's alerting capabilities.
- Charts and Tables
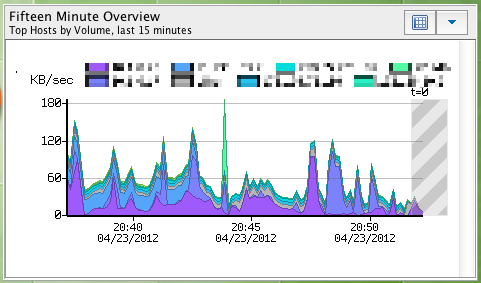
The Charts and Tables widget displays an automatically refreshed chart and table with a timeframe relative to now. Use it to get a quick overview of the activity of the last hour, day, or week. Each such widget represents the content of a single View (see the section called “Views”). You can specify a session filter (see the section called “Filtering”) and a refresh rate suitable to the interval displayed.
- Flow Rate
The Flow Rate widget shows the total number of incoming flows processed by FlowTraq over time.
- Message
The Message widget is designed to store useful text, like a sticky-note. To configure it, just write the message you wish to display.
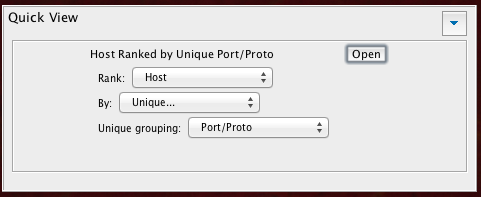
- Quick View
Use the Quick View widget to quickly launch a workspace showing a given view.
- Reports
The Reports widget provides an interface to schedule and retrieve reports.
- Server Status
The Server Status provides a few key server statistics.
- Workspaces
The Workspaces widget provides an interface to manage and launch saved and built-in Workspaces.
This chapter describes how to use the FlowTraq Java desktop interface to perform interactive reporting and analysis via the Workspace window.
FlowTraq Workspaces are interactive flow investigations. The Workspace user interface allows you to quickly build reports interactively by setting timeframes and filters at the click of a mouse and selecting views that show the statistics you are most interested in. The Workspace is designed with "pivoting" in mind; if you see something interesting in the data, interact with it to get a better view. For instance, you can drag mouse across a graph to zoom in on a timeframe of interest. Or, you can right-click on a row of a table to quickly filter on the corresponding host, country, application, or other entity.
These are just a few of the things you can do to quickly and interactively gain insight into your network traffic. This section provides a detailed overview of the Workspace window.
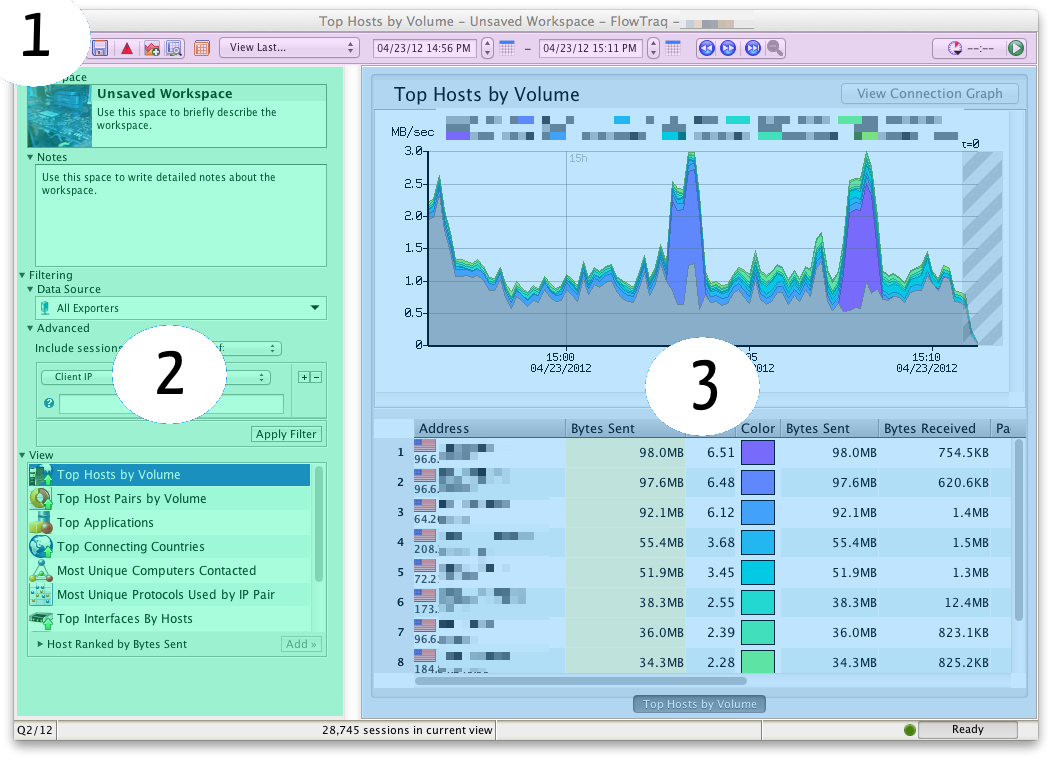
The Workspace window is organized into three major sections:
The toolbar, on top, includes all the timeframe navigation tools, as well as buttons to save a Workspace to the Dashboard, schedule the current Workspace as automated report, generate alert notifications based on the Workspace, open Session Explorer, and set up automatic refresh of the workspace.
The sidebar, on the left, includes the Workspace descriptions as well as all of the filtering and View selection controls.
The main data display shows the results of the current query. Session data is displayed in one or more Views, which are rankings of the session data displayed as a stack chart, a table, and (for pairwise rankings) an interactive connection graph which allows you to visualize connections between entities.
FlowTraq provides a variety of built-in Workspaces designed to demonstrate FlowTraq's flexible filtering capabilities. To launch one of them, find or create a Workspaces widget that is configured to show the Example Workspaces, and double-click one of the example Workspace's badges. A new Workspace window will launch.
To customize a Workspace, begin by launching either an example Workspace (see above) or a new Workspace (select the "New Workspace" button from the Dashboard toolbar or select File > New Workspace from the Workspace menu).
Once a Workspace window is open, you can customize the timeframe, filter, and Views by using the controls in the time navigation toolbar and the sidebar.

The time navigation toolbar allows you to quickly select commonly used timeframes, specify a time and date range you are interested in, and navigate forward and backward to the previous or next time segment. This toolbar also allows you to configure automatic refreshing.
To quickly specify a timeframe relative to the current time, use the first two controls on the toolbar: the Time Selection Mode toggle button and the Time Selection dropdown. Use the toggle button to select either the View last... or the Fixed Frame modes, and then use the dropdown to select a timeframe.
| Tip |
|---|---|
Both the View last... and the Fixed Frame modes select time frames relative to the current time, and can be used with the auto-refresh, which will refresh the screen with new data at regular intervals. |
By default, the time selection method is View last.... In this mode, the dropdown will show options for the last 15 minutes, 30 minutes, 1 hour, 3 hours, and so on. Selecting any of these will cause the workspace to refresh to the selected time segment.
In Fixed Frame mode, the dropdown contains options for this hour, last hour, today, yesterday, and so on.
| Tip |
|---|---|
If you prefer to specify a timeframe by hand, use the start and end time boxes and spinner controls to specify the times you're interested in. Enter a date, or use the Calendar popup button to quickly navigate to relevant dates. Finally, after entering your timeframe, click the Refresh button to retrieve the data. If you specify a timeframe by hand, any selections you have already made in the Time Selection dropdown are ignored. |
You can navigate to the previous or the next segment in time using the Forward and Backward buttons on the right side of the time navigation bar, and you can quickly move the timeframe so that it ends at the current time by pressing the Forward To Now button.
Finally, in the data display, you can zoom in by dragging the mouse across the graph while holding down the left button. This will zoom in on the selection region and refresh the data automatically.
| Long-Running Sessions |
|---|---|
When a session overlaps the selected timeframe but the start time is before the start of a time frame, or end time is after the end of a time frame, that session's statistics are pro-rated to the timeframe. That is, suppose hosts are being ranked on bytes transferred, and a host has a session that is 50% in the selected timeframe, and 50% out of it; in this case, only half the bytes in the session are counted to that host. |
FlowTraq offers extensive and powerful filtering capabilities. Filters can be configured in the Workspace sidebar, in the Report Scheduler, and in the Alert Scheduler. In all three cases, filters are configured in the same way.
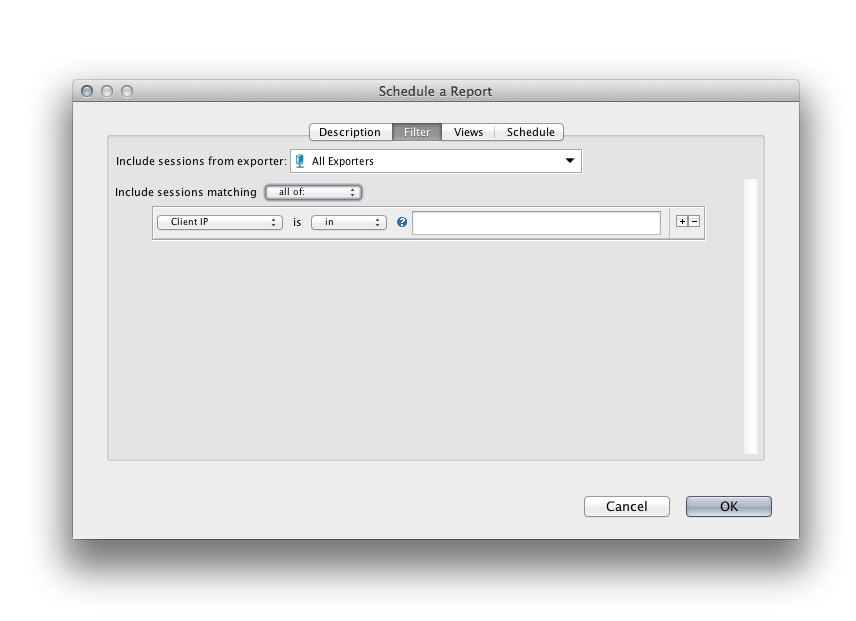
Generally speaking, you configure a filter by combining constraints which specifies which traffic to included or exclude from your investigation. The Filtering panel looks like this:
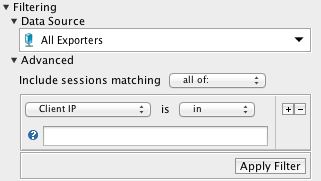
The first constraint you can specify is the data source selection. If you may have more than one flow source reporting flows to FlowTraq Server, you may use the Data Source dropdown to select an exporter or a particular interface on an exporter to use as the data source. (You can also keep the default setting, "All Exporters"). If you choose an exporter or an interface, subsequent reports will include only traffic that was reported by that device, or which passed through that interface.
Subsequent constraints are specified in the Advanced Filter panel. You can form these constraints as easily as you can form English sentences by selecting from dropdowns and completing the fields in a filter box, which is sometimes referred to as a Filter Line. You can also add and remove Filter Lines as you see fit by clicking on the '+' and '-' buttons on each Filter Line.
Most Filter Lines can accept comma-separated sets of host names, CIDR blocks, numeric ranges, or mnenomics (such as "tcp" for protocol), as appropriate to their type. Others, such as the country code selector, provide an interface that allow you to select values. All Filter Lines have a validation icon which indicates if the value entered has been accepted. When you start typing, the validation icon turns into a question mark. When the icon turns green, the filter box value has been accepted and can be applied. If the icon turns red, you have entered an invalid value for the Filter Line, and your input on that Filter Line will be ignored. (You can click the validation icon for an explanation of why your input was rejected.)
| Combining Filter Lines |
|---|---|
By default, Filter Lines are combined by logically "AND"-ing them together. That is, if you specify the following three Filter Lines: A, B, & C, only sessions for which A AND B AND C are true will be included in the report. If you'd like to "OR" them together, change the Combination Rule by changing the dropdown in the that says "Include sessions matching ALL of:" to say "Include sessions matching ANY of:". |
Values entered into a particular Filter Line are combined by logically "OR"-ing them together.
| Filtering Example 1 |
|---|---|
If you want to filter on traffic (to or from) either 172.16.2.2 OR 192.168.12.12, use this filter: 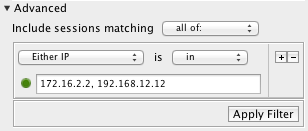 Instead, if you want to filter on traffic between the two addresses (that is, both 172.16.2.2 and 192.168.12.12 are part of the session, but without regard to which is the client and which is the server), then use this filter: 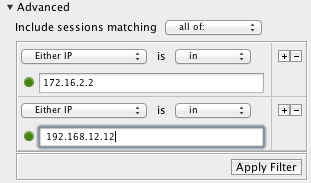 And if you would only like to see traffic where 192.168.12.12 is the server, and 172.16.2.2 is the client, use this filter: 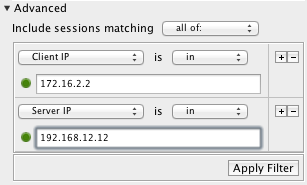 Now, if you want to see traffic that went to either 172.16.2.2 OR 192.168.12.12, used protocol TCP, and went to server port 80 (HTTP), then try this filter: 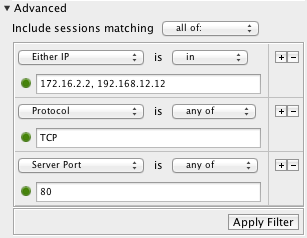 |
| Filtering Example 2 |
|---|---|
In some cases you might want to OR the filter boxes. For instance, suppose your accounting division uses VLAN 5, and the accounting database server is 192.168.12.33. You want to filter on all accounting traffic. In this case you set the combination rule to be "Include sessions matching ANY of:" 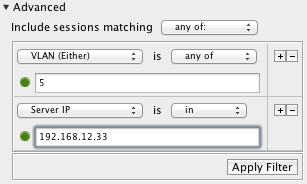 This filter includes all traffic on VLAN 5, regardless of destination or protocol, and all traffic going to the accounting server. |
| Filtering Example 3 |
|---|---|
Suppose you have a dedicated VLAN for your IP phones (say, VLAN 6), but you suspect that some of the phones may have been misconfigured and are using bandwidth on the regular bulk data network. The filter to detect this behavior will have to exclude the VOIP VLAN but include all non-bulk TOS traffic to the VOIP servers (say, in the 69.59.241.0/24 class-C block). A filter to find all your rogue VOIP phones might look like this: 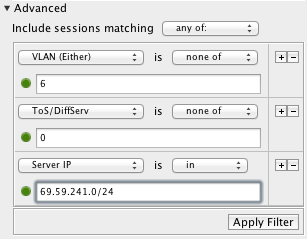 |
| Raw Filter Strings |
|---|---|
You can view the raw filter string corresponding to a set of Filter Lines by selecting View > Filter String: 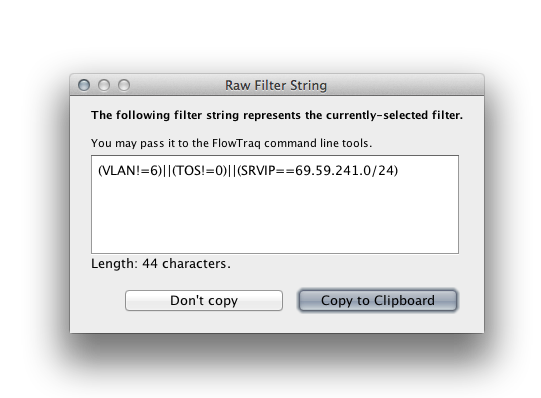 You can use the raw filter string on the command line, or as a starting point for more complex filter strings. If you find that you cannot fashion the filter you need to using the Filter Line interface, you can enter a raw filter string by selecting "raw query:" as the Combination Rule: 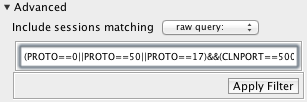 See Section 3.2.4, “Filter String Syntax” for more information on the filter language syntax. |
Below is the full list of fields that can be filtered on:
- IP address/hostname/CIDR block
The most common filter is a host filter or address block filter. You may specify client, server, or both. This is useful, for instance, if you want to find all inbound connections to your web server, but are not interested in outbound connections that the web server initiates itself.
Valid inputs are IPv4 addresses in dotted-decimal notation; IPv6 addresses; hostnames (be sure to wait for the validation icon to indicate the name was successfully resolved); and CIDR blocks (both IPv4 and IPv6). CIDR blocks are a convenient way of specifying an entire subnet; for example, use 192.168.12.0/24 to include all addresses from 192.168.12.0 to 192.168.12.255.
- MAC Address
Filter on the MAC addresses in the session, as reported by the exporter (IPFIX fields 56 and 80).
- Port
Filter on the port number. It is possible to specify a range of ports by choosing
between; enter ranges using a dash. For example, selectingbetweenwith a value of "10000-20000" will find all sessions with port numbers between 10,000 and 20,000.- Protocol
Filter on a protocol. Accepted mnemonics are TCP, UDP, and ICMP. Numeric protocol values are also allowed.
- Country
Filter on sessions to or from a particular country. Click the "Edit" button to get a list of countries, and select countries to include in the filter by toggling their country-code button. A list of selected countries and their flags will appear in the Filter Line.
- Bytes
Filter on session byte volume. For instance, if you only want to view sessions where the client sent at least 500 bytes, then select "Client Bytes", "at least", and supply the value "500" in the input field.
Important Selecting "Either Bytes" does NOT sum the client and server-side bytes together. Rather, it acts as a logical OR. Use "Total Bytes" to filter on the total bytes.
- Packets
Filter on session packet volume. In all ways analogous to Bytes.
- ToS/DiffServ
Filter sessions based on the value in their ToS or DiffServ field. The values are numeric, so you might need to specify a range to get the desired effect.
Important Note that this field has a different meaning for IPv4 and IPv6.
- Flow Duration
Filter sessions based on their duration. This field is numeric and given in seconds.
Tip From a security perspective, it may be useful to filter on particularly long-lived connections. To do so, select the "at least" option and supply a value of 7200 in the input field to include only sessions that lasted at least 2 hours.
- VLAN
Filter on the session's VLAN numbers.
VLANs are a convenient way to group classes of systems together. VLAN specifiers are numbers between 1 and 4096. Most sessions will have the same VLAN ID for both VLAN In and VLAN Out. Devices that route packets between VLANs will export flows where the VLAN In and VLAN Out differ. When VLANs are not used, this value is commonly set to 0.
Exporter VLAN Support Not all flow sources include VLAN information in their flow updates. In particular, NetFlow v5 does not include VLAN information, and some versions of cFlow, and jFlow also do not.
- ASN
Filter on the session's Autonomous System Numbers. Some routers keep BGP tables to make routing decisions at the autonomous system level. These routers may include the ASN of the client and the server address in the flow records. You can use this option to filter on this field.
- Interface
Filter on the exporter-reported Interface In and Interface Out numbers of the session.
This serves a similar function to the feature provided by the Data Source selection box. Use this if you want to filter on more than one interface, but not all interfaces.
Interface numbers range from 1-65536. A value of 0 indicates no interface number was present in the flow records.
- Exporter IP
Filter on the IP address of the exporter which reported the session.
This serves a similar function to the feature provided by the Data Source selection box. Use this if you want to filter on more than one exporter, but not all exporters.
- Exporter Version
Filter on the NetFlow/sFlow version of the exporter which reported the session. Click the "Edit" button to get a list of versions, and select versions to include in the filter by toggling their buttons. A list of selected versions and their badges will appear in the Filter Line.
- NSEL Event
Filter on the NSEL event code of the session. Typically, NSEL events correspond to a flow being accepted, denied, or deleted by the firewall.
Click the "Edit" button to get a list of event codes, and select event codes to include in the filter by toggling their buttons. A list of selected event codes and their numbers will appear in the Filter Line.
- NSEL Ext. Event
Filter on the NSEL extended event codes of the session. Typically, NSEL extended event codes explain why a flow was denied by the firewall.
Click the "Edit" button to get a list of event extended codes, and select event codes to include in the filter by toggling their buttons. A list of selected event codes and their numbers will appear in the Filter Line.
FlowTraq has the ability to rank your selection of traffic in hundreds of different ways. Each such ranking is called a View. Being able to analyze traffic from multiple angles often reveals unexpected details, so Workspaces can show many Views at once, in tabs.
| Important |
|---|---|
You must have add least one View to the Workspace before you can retrieve and analyze traffic. |
In general, each View consists of a stack chart and a table which serves as a legend for the stack chart. Stack charts are a convenient way to visualize ranked data over time. The top-ranked item appears at the bottom of the graph; stacked on top of it is the second-ranked item; and so forth:
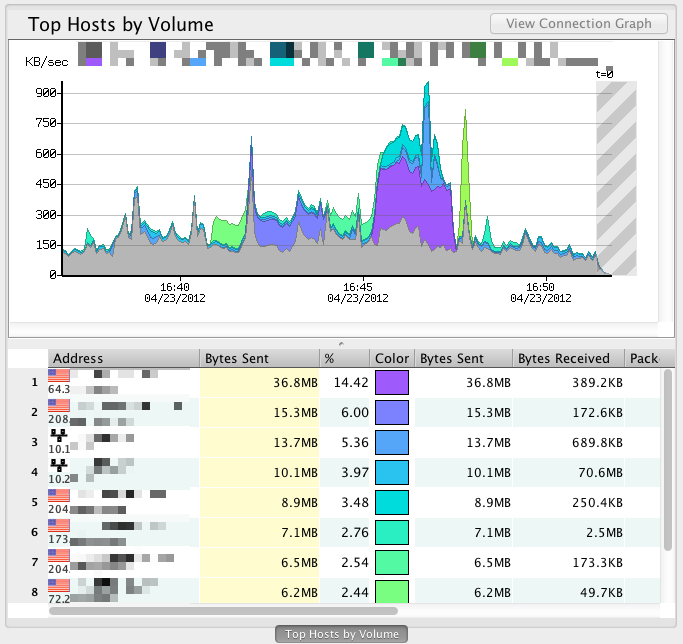
The grayed-out crosshatch area on the chart roughly indicates the present time. More specifically, it indicates when insufficient flow data has been received to compile a completely accurate representation of the traffic. In general, the crosshatch area starts at about 60 seconds into the past, and extends indefinitely into the future.
Tables show the same data as the chart above them, but in a sortable table format. In fact, you can click on any part of the chart and FlowTraq will highlight the corresponding row in the table below.
| Tip |
|---|---|
Use the View > Top-10, View > Top-25, ..., View > Top-1000 items in the Workspace menu to indicate how many rows FlowTraq should include in its rankings. |
You can right-click on any item in the table to see contextual options (for instance, you can add an item to your session filter).
You can also change the widths of the columns and rearrange columns for your convenience. (This setting is remembered on a user-by-user basis.)
By default, the second column in the graph is highlighted. This is the column that was used to perform the ranking. In the example, above the data was sorted based on the number of bytes sent by each host. This means that the items in the table are the top hosts, ranked by bytes sent.
The columns further to the right give additional insight into the top hosts.
| Important |
|---|---|
Although you can sort by the non-highlighted columns, they do not constitute a ranking by themselves. That is, if you re-sorted the above table by "Sessions Initiated," you will see the hosts that initiated the largest number of sessions that also happened to make it into the original ranking, which was "Top Hosts by Bytes Sent." In order to make a "Top Hosts by Sessions Initiated" ranking, you must add a new View in a separate tab. This is described below. |
| Tip |
|---|---|
Pairwise Views can also be visualized as Connection Graphs. See the section called “The Connection Graph” for more information. |
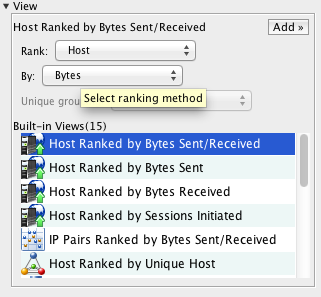
FlowTraq provides a number of built-in Views, which represent the most frequently used rankings.
To add a built-in View to a Workspace, select it from the View table and select "Add".
Built-in Views only scratch the surface of FlowTraq's capabilities. Use Custom Views to explore the unique properties of your network.
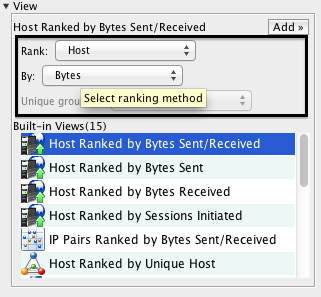
To define a custom view, select "Custom View..." in the View table, make your selections using the dropdown menus which appear, and click "Add" to add the view as a tab in the workspace.
Views are defined by selecting what entity to Display (or rank), and what aspect of that entity to rank. For instance, "Display: VLAN Ranked by Packets" will show you the top VLANs based on the number of packets that were seen on that VLAN during the specified timeframe. On the other hand, "Display: VLAN Ranked by Bytes" will show the top VLANs based on the number of bytes seen. You may get a completely different ranking, because the byte volume of traffic can differ significantly from the packet volume on a given VLAN.
| Tip |
|---|---|
Take some time to familiarize yourself with the pairwise View (such as rankings of IP pairs) and unique-count Views (such as "Top Hosts Ranked by Unique Host"), as they are among the most powerful kinds of Views. |
Defining your own View can be a powerful way to explore your traffic.
Each View you add to a Workspace becomes a tab in the data display. Select the tab to show that View in the display.
| View Tab Limitations |
|---|---|
You can add up to ten concurrent Views in the data display. In addition, there are certain rules about which Views can be combined with which other Views. For instance, you can only add 2 View tabs that rank hosts or host pairs. If you attempt to add a View tab when either the maximum number of View tab has already been added, or a conflicting set of View tabs has already been added, the "Add" button will be disabled. This limitation is imposed to limit the memory usage by the server during query processing, and can be worked around by creating a second similar workspace, or by removing one or more View tabs before proceeding. To remove a View, right-click on the View tab and select "Close Tab" to remove it. (Alternatively, select "Close Other Tabs" to remove all Views except the one represented by the selected tab.) 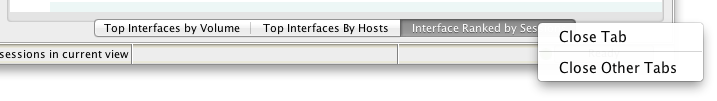 |
When a pairwise View is the active tab, a button labeled "View Connection Graph" is available in the upper right-hand corner of the data display:
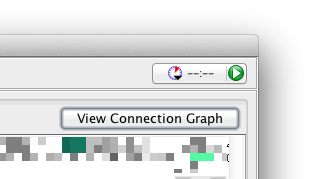
Use this button to toggle between the chart/table display and the Connection Graph:
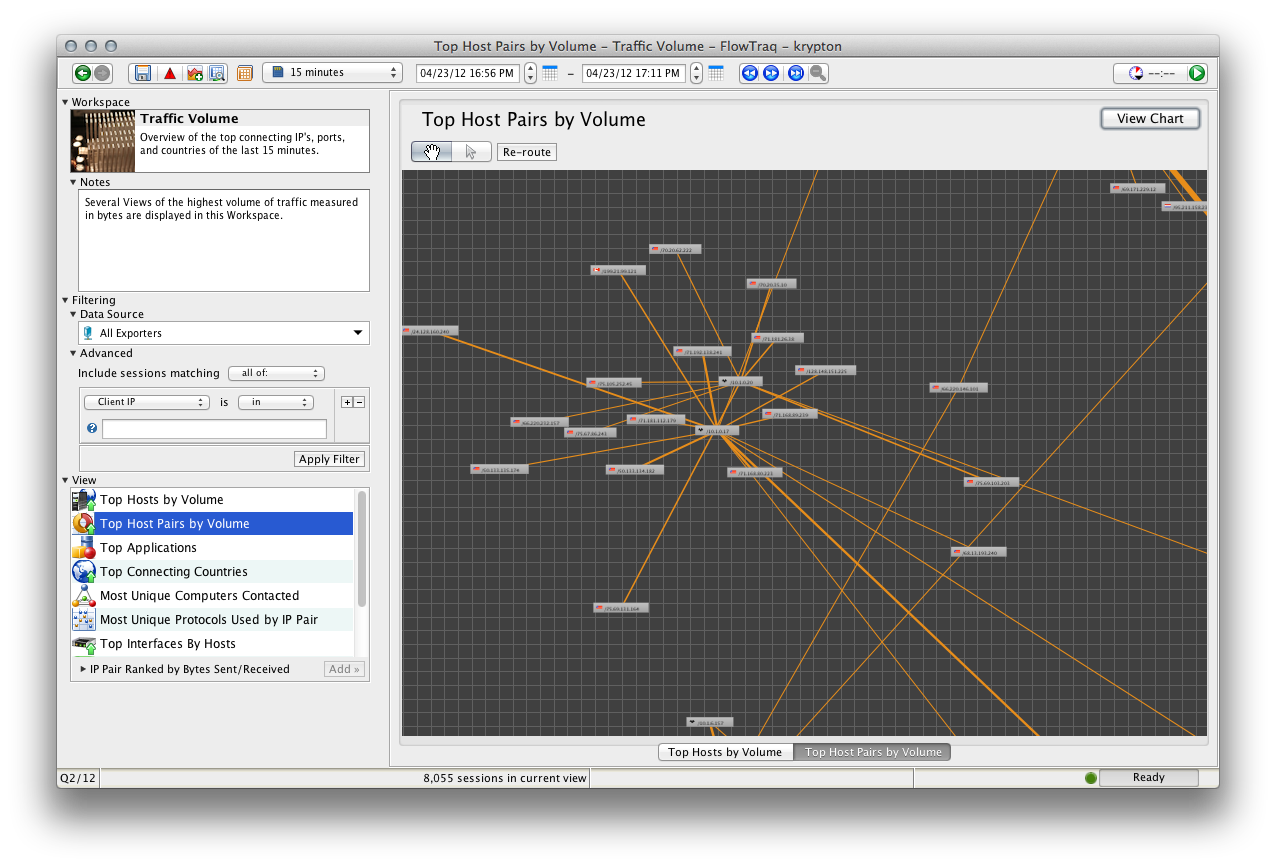
In Connection Graph mode, entities are displayed as badges with lines indicating connections between them.
To navigate the Connection Graph, click the "Hand" icon and drag the mouse within the graph, and zoom in and out using the mouse wheel or trackpad scroll gesture.
To interact with entities on the Connection Graph, click the "Cursor" icon, and then click or drag to select entities or groups of entities. Once selected, entities can be rearranged by dragging, or right-clicked to present a contextual menu.
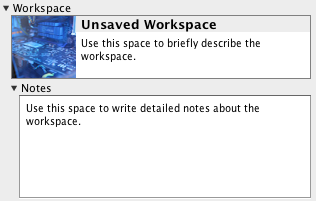
FlowTraq provides you with spaces in the sidebar to briefly describe your Workspace and make notes to remind you of the status of your investigation. Feel free to use these spaces in ways you find appropriate.
In addition, you may select a Workspace icon to help you quickly identify your Workspace in the Workspaces widget. To do so, click on the icon in the Workspace badge and an icon chooser will appear:

Click on the desired icon to select it.
FlowTraq provides several options for saving Workspaces.
You can save a Workspace to your user Dashboard and access it later via a Workspaces widget.
You can export a Workspace to disk as a
.wsfile, which can be shared and re-imported via the Dashboard. You may find this useful for sharing your Workspaces with others in your organization.
| Important |
|---|---|
Note that saving a Workspace stores the timeframe, filter, selected Views, your description and notes, and name of the Workspace. It does not store the results of a particular report, but rather the information needed to re-run a report later. To save an interactive report's actual results, please export a PDF, or print the results (see below). |
To save a Workspace to your Dashboard, use the "Save" button on the toolbar, or select File > Save Workspace from the Workspace menu.
| Important |
|---|---|
If you are saving a Workspace for the first time, you will be prompted to name your Workspace. |
The Workspace's details will be stored on FlowTraq Server, and will appear on your Dashboard in a Workspaces widget.
Like saving a Workspace to your Dashboard, exporting a Workspace saves the Workspace's configuration but not the results.
To export a Workspace to disk, select File > Export Workspace... from the Workspace menu.
To import a Workspace, select File > Import Workspace... from the Dashboard menu.
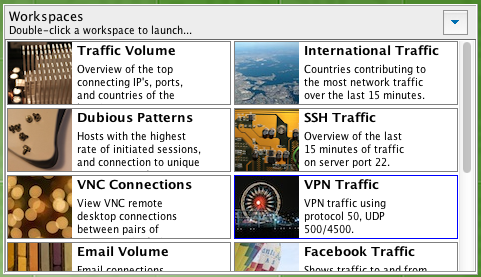
When you save a Workspace, it will appear as a badge in a Workspaces widget on your Dashboard. From there, you re-open saved Workspaces.
| Important |
|---|---|
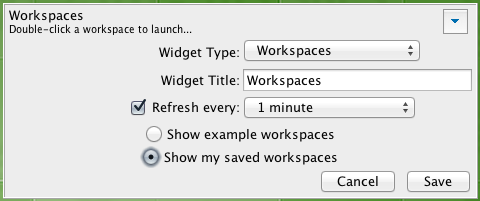 The Workspaces widget has two modes. In one mode, it shows a built-in set of Example Workspaces. In the other, it shows your saved Workspaces. If you do not have a Workspaces widget on your Dashboard that is configured to show your saved Workspaces, you must create one in order to re-open your saved Workspaces. |
| Tip |
|---|---|
You can also delete saved workspaces by right-clicking them and selecting the appropriate menu item. |
To save an interactive report's actual results, FlowTraq provides two options:
You can print the report. To do this, select File > Print Report... from the Workspace menu, and follow the on-screen instructions.
You can export a PDF of the report. To do this, select File > Export PDF... from the Workspace menu and choose a file name and location.
One of the most powerful and unique features of FlowTraq is the efficient storage of flow records with full fidelity. This technology lies at the foundation of FlowTraq's capability to flexibly and quickly generate arbitrary reports.
It also enables you to view the actual session records collected FlowTraq, which allows you to isolate individual sessions or export sets of sessions for your own analysis.
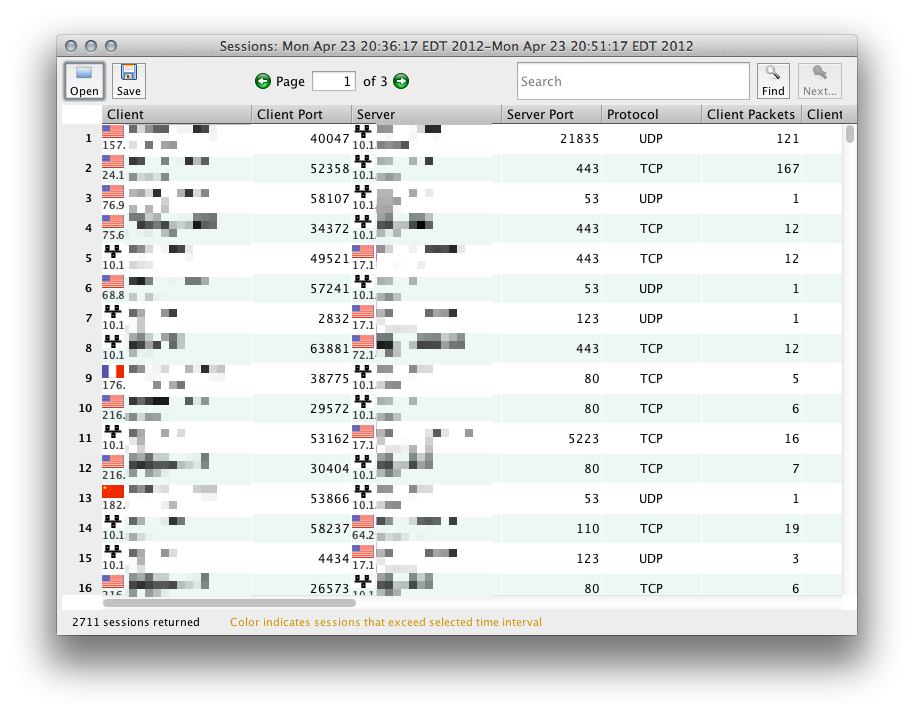
Session Explorer provides the interface for viewing, searching, sorting, and saving session records.
There are two way to access Session Explorer.
From a Workspace, you can retrieve the sessions that match the active timeframe and filter and open them in Session Explorer. To do this, take the following steps:
Open a Workspace and use the Time Navigation toolbar and Filter sidebar to select sessions of interest. (For more information on Time Navigation and Filtering, see the section called “Time Navigation” and the section called “Filtering”).
Click the Fetch All Sessions button from the Workspace toolbar.
Important Session Explorer will immediately start downloading matching sessions using the filter and timeframe you currently have defined in the Workspace. If there are millions of sessions in your current view, this may take some time.
To import a session record that you previously saved from within Session Explorer, select the Import Sessions button from the Dashboard toolbar, or select File > Import Sessions... from the Dashboard menu.
Session records contain a number of fields, including the IP addresses of the client and the server in the conversation, information about the exporter which reported the session, TCP flags (if applicable), the country of each address, server and client port numbers (for TCP and UDP), VLAN IDs, and timestamps of the start and end of the session.
| Long-Running Sessions |
|---|---|
When a session overlaps the selected timeframe but the start time is before the start of the selected timeframe, or end time is after the end of the selected timeframe, that session is included in Session Explorer, but start times and/or end times are marked in yellow to indicate that the session is partially outside the selected timeframe. Note that, in contrast to the rankings generated by FlowTraq, the information in raw session records is not pro-rated to the selected timeframe. |
To sort on any of the session fields, click on the appropriate column header.
Important If Session Explorer is showing a large number of records, it may take some time to sort them.
Records are paginated in sets of 1000. To navigate pages, use the left and right arrows in the toolbar. Alternatively, enter a page number.
To search the session records, enter your search term in the Search bar and use the Find and Next... buttons.
Tip Press
ENTERkey in the Search field as a shortcut to the Find or Next... buttons.To save session records to disk, select File > Save from the Session Explorer menu, or click the Save button.
Tip Session records are saved in CSV format. They can be opened in Session Explorer or any other application that supports the CSV format.
FlowTraq's full-fidelity flow database allows you to generate reports at any time without having to concern yourself with whether the source information is still available: as long as the session database's maximum size is large enough, FlowTraq will maintain the historical record indefinitely without aggregation.
| Important |
|---|---|
When the session database has reached its maximum size, FlowTraq will remove the oldest records first. |
While it is useful to be able to interactively generate reports after-the-fact, some reports take longer to perform than others. For instance, it may take minutes or hours to generate a report with a one-month or one-year timeframe. In particular, if the records needed to perform a query are on disk, rather than in FlowTraq's memory cache, generating reports interactively might be prohibitively slow.
Additionally, you might simply want to see the same data at regular intervals.
For these kinds of situations, FlowTraq has a flexible report scheduling function. Any kind of report which you can generate interactively in a Workspace can also be scheduled to run automatically and regularly and retrieved from the Dashboard for viewing, printing, or saving to PDF.
This chapter describes how to schedule, retrieve, and manage scheduled reports.
Reports are scheduled using FlowTraq Client, but the report schedule is stored by, and performed by, FlowTraq Server. This means FlowTraq Client does not have to running in order for reports to be generated; in other words, if you schedule a report to run every day at midnight, and then you close FlowTraq Client and go home for the day, the results of that report will be waiting for you the next time you log in to FlowTraq.
To schedule a report, take the following steps.
Access the "Schedule a Report" window. There are two ways to access it:
From within a Workspace window: click the "Schedule Current Workspace As Report" button on the toolbar.
From the Dashboard: right-click an empty row of a Reports widget and select "Schedule New Report".
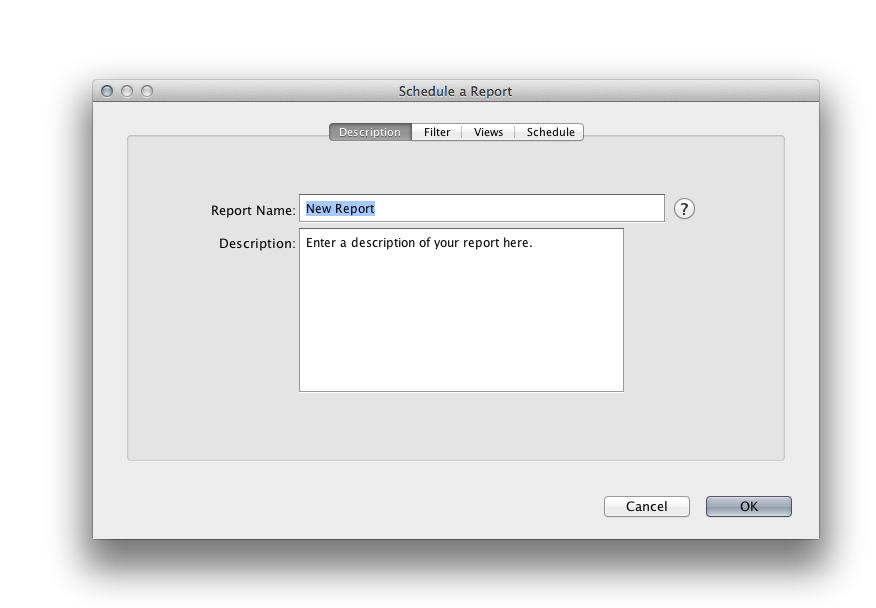
On the "Description" tab, title your report and, optionally, provide a brief description.
On the "Filter" tab, set the session filter you would like to be applied when generating the report.
Tip If you accessed the "Schedule a Report" window from a Workspace, the session filter you specified there will be carried over into the report.
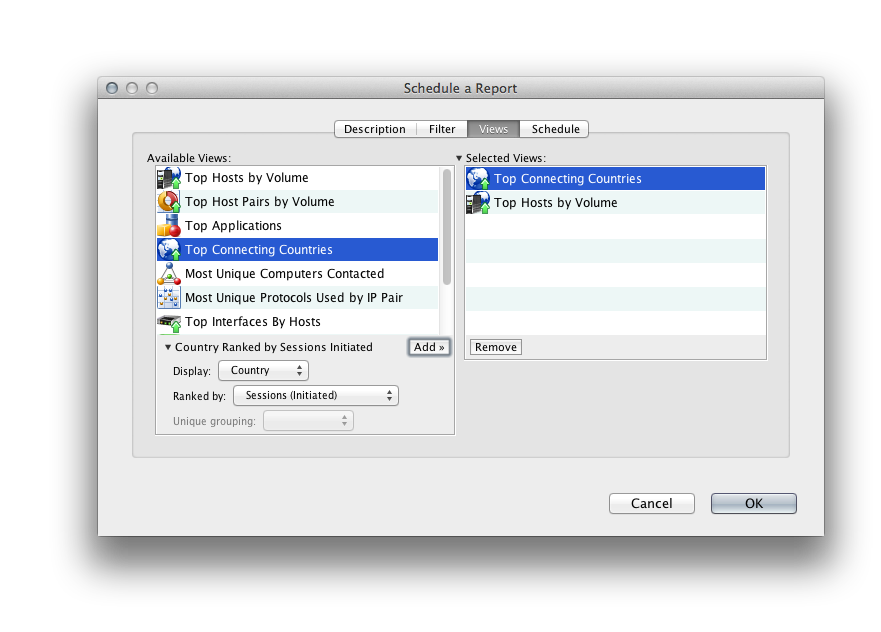
On the "View" tab, select the Views you want to be included in the report. Click "Add" on the left-hand pane to add a view to the right-hand pane.
Tip If you accessed the "Schedule a Report" window from a Workspace, any Views you have selected there will be carried over into the report.
On the "Schedule" tab, configure when the report will run and the desired report duration.
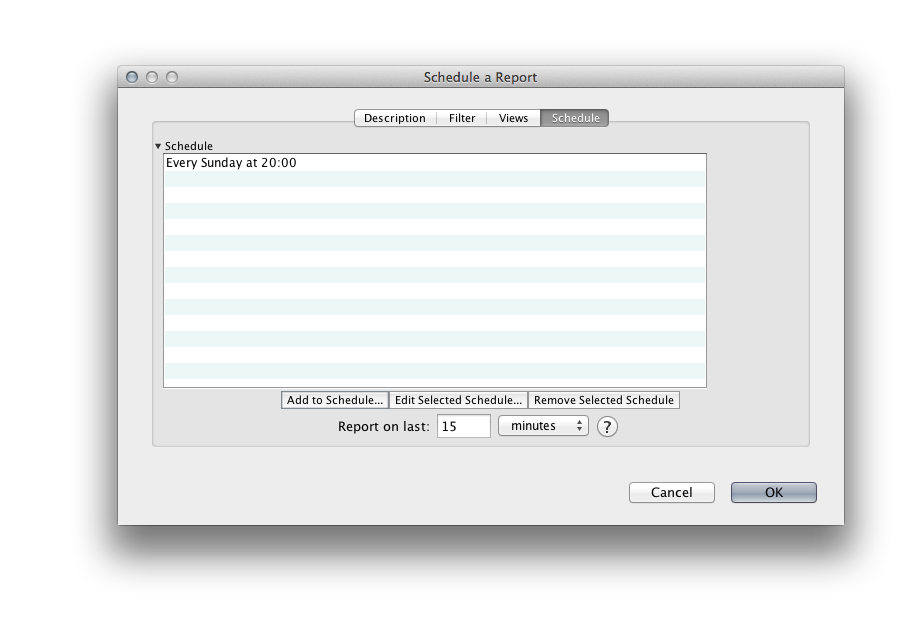
To configure when the report will run, click the "Add to Schedule..." button and, in the window that appears, choose how frequently you want the report to run (hourly, daily, weekly, monthly, or annually) and at what time of day (or day of week, etc) you want it to run.
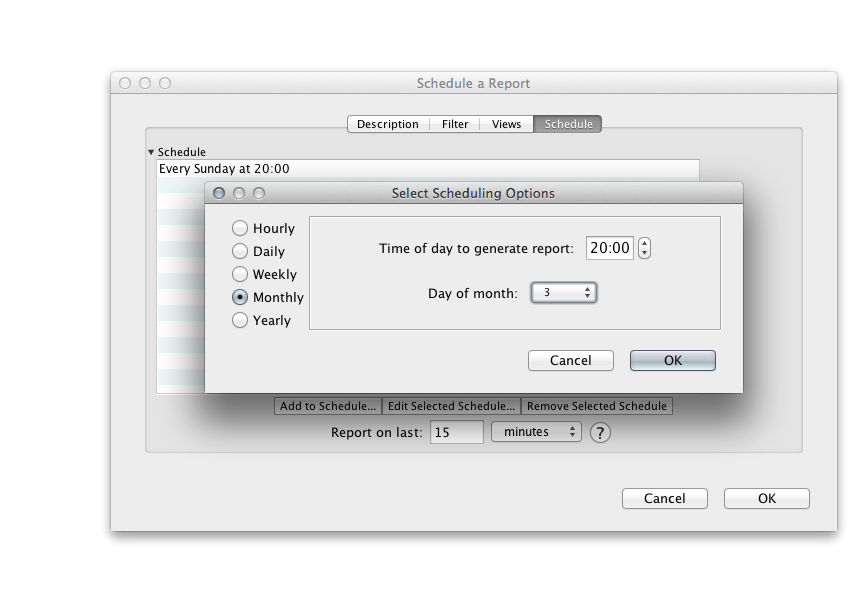
Tip You can add more than one line to the schedule. This allows you to configure the report to run at a variety of times.
After configuring when the report will run, enter the desired report duration by completing the Report on last: field. This determines the timeframe over which the report will be generated.
Example To generate a report for the 9am-5pm timeframe of each work day (Monday through Friday) at the end of the work day, you must add five lines to the schedule: One for each Monday; one for each Tuesday; and so on.
Add a line to the schedule, and select Weekly, then Monday. Set the time to 17:00.
Repeat this four more times for the other four days of the week.
Finally, in the "Report on last:" entry, enter 8 hours.
FlowTraq will generate a report of each work day's traffic automatically at the end of the work day.
Click "OK" and the report will be scheduled.
The Reports widget provides the interface for retrieving and managing scheduled reports. To add a Reports widget to your Dashboard, create it as you would any other widget. (See Section 3.3.1, “The Dashboard” for more information on managing the Dashboard.)
The Reports widget has two modes:
Show Generated Reports. In this mode, the Reports widget displays the list of generated reports. Suppose one week ago you scheduled a report to run every day at midnight. In this mode, the Reports widget would display seven rows, each of which represent the results of a single run of that report.
Show Report Schedule.In this mode, the Reports widget displays the list of report types you have scheduled. Suppose one week ago you scheduled a report to run several times a day. In this mode, the Reports widget would display only one row, representing that scheduled report.
To toggle between these modes, click the toggle button, which is the first button on the widget's title bar.
To edit, disable, or delete an already-scheduled report, take the following steps:
Put the Reports widget in Show Report Schedule mode.
To edit a report, double-click on the report you want to edit, or right-click on it and select "Edit Report Schedule." The "Schedule a Report" window will appear. Make the desired changes to the report's description, filter, views, or schedule, and click OK to save your changes.
To disable or delete an alert, right-click on the alert you want to disable or delete and select the appropriate item from the context menu.
You can retrieve the result of a scheduled report and view it in a window, send it to a printer, or save it as a PDF. To do so, take the following steps:
Place the Reports widget in Show Generated Reports mode.
To view the results of a report in FlowTraq, double-click on the report you want to retrieve and a window will appear. Alternatively, to print or save the results, right-click on the report and select "Print Report" or "Save Report."
The results of reports are stored on FlowTraq Server and are very compact. Still, over time you may find that your Report widget lists reports that are no longer useful to you. To delete one or more reports, take the following steps:
Place the Reports widget in Show Generated Reports mode.
Select one or more generated reports. You can select more than one by using the Shift key (to select a range) or the Command/CTRL key (to select several non-contiguous reports).
Right-click on the selected report or reports and select "Delete Report(s)", and confirm your selection in the dialog box that follows.
Caution You cannot undo this operation.
FlowTraq is able to generate alert notifications in real time based on user-specified conditions. When such a condition is met, FlowTraq is able to generate notifications of alert conditions in several ways:
Alert notifications are displayed in an Alert widget on the Dashboard of the user who set the condition.
Alert notifications can optionally be e-mailed to the user who set the condition.
Alert notifications can optionally be sent via syslog over UDP for integration with third-party SIEM (security information and event management) systems.
Alert notifications can optionally be retrieved via the command line for scripting.
An alertable condition (or simply alert condition) is a time-based threshold set on any metric which can be calculated using network flows. For instance, "number of sessions initiated by any one host exceeds one thousand over a period of thirty minutes" is an alertable condition. If it is set, FlowTraq will track the number of sessions initiated by all hosts, and at any time, if a host initiates more than one thousand sessions over the course of two minutes, FlowTraq will notify the user who set the alertable condition.
In addition, FlowTraq allows you to specify a prefilter to indicate what kinds of sessions to include when tracking for a given alertable condition. The prefilter is configured in the same way as report filters.
This chapter describes how to configure, retrieve, and manage alerts.
Like reports, alerts are configured using FlowTraq Client, and like reports, the list of alerts is stored by FlowTraq Server. Also, FlowTraq Server is responsible for generating notifications. This means FlowTraq Client does not have to running in order for alert notifications to be generated; in other words, if you set an alert and then close FlowTraq Client, notifications will still be generated whenever the alert's condition is met.
To configure an alert, take the following steps.
Access the "Alert Editor" window. There are two ways to access it:
From within a Workspace window: click the "Alert" button on the toolbar.
From the Dashboard: right-click an empty row of an Alerts widget and select "Schedule New Alert".
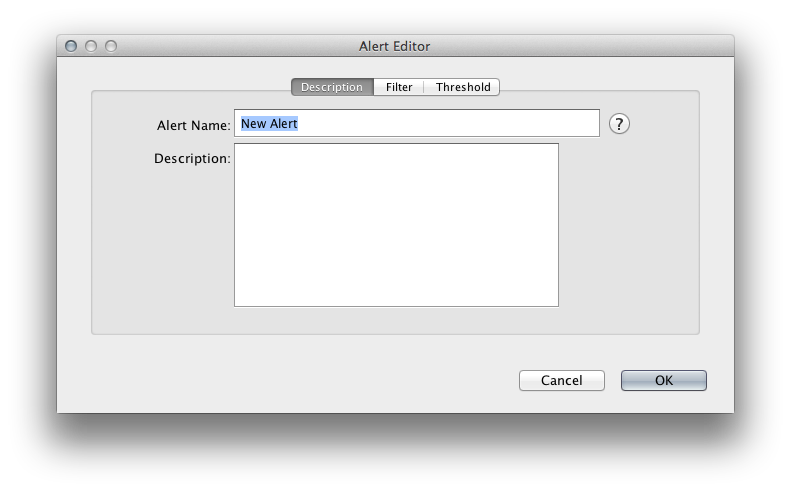
On the "Description" tab, title your alert and, optionally, provide a brief description.
On the "Filter" tab, set the session filter you would like to be applied when testing for the alert condition.
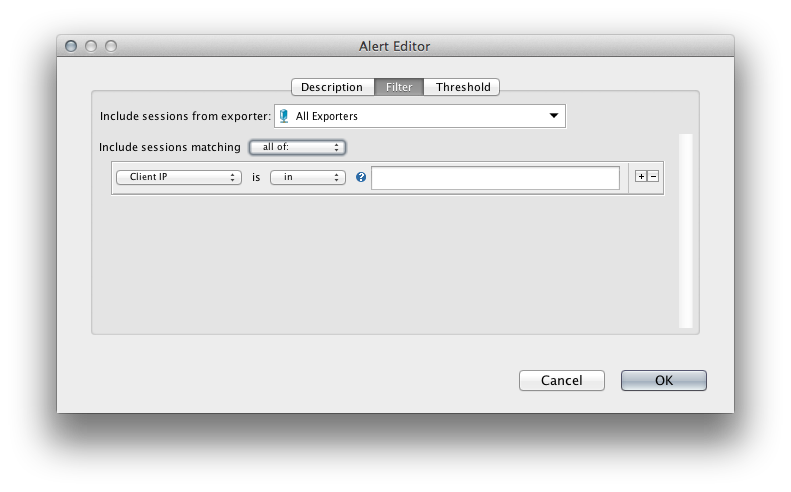
Tip If you accessed the "Alert Editor" window from a Workspace, the session filter you specified there will be carried over into Alert.
On the "Threshold" tab, set the condition on which to generate a notification by using the controls to fill in the blanks of the sentence displayed in the window:
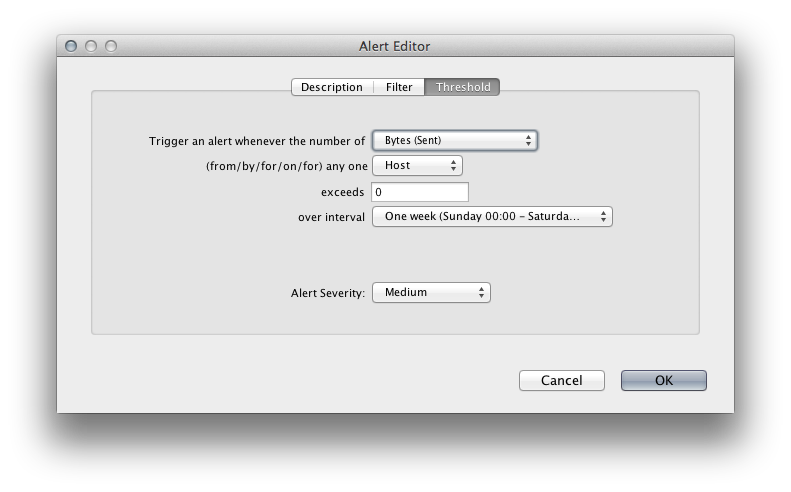
On the first line, select the metric to measure. For instance, you can measure inbound or outbound bits, bytes, packets, or sessions for each entity.
Tip You can also measure the number of unique entities an entity associates with. For instance, if you select "unique hosts," FlowTraq will keep track of how many unique hosts are associated with each entity.
On the second line, set the entity on which to measure the the metric. You can choose from Host, Host Pair, Port, or Country.
On the third line, set the threshold, as a numeric value.
On the fourth line, select the time period.
On the final line, select the alert's severity.
Example Complete the "Threshold" tab as follows to cause alert to be raised when ever a host contacts more than one hundred unique other hosts in an hour: Trigger an alert when the number of Unique Hosts for any one Host exceeds 100 over interval One Hour.
Now go back to the "Filter" tab and set a filter of Server port is any of: 22 to alert only if a host contacts more than one hundred other unique hosts using the SSH protocol.
Click "OK" and the alert will be configured.
The Alerts widget provides the interface for retrieving and managing Alerts. To add an Alerts widget to your Dashboard, create it as you would any other widget. (See Section 3.3.1, “The Dashboard” for more information on managing the Dashboard.)
The Alerts widget has two modes:
Show Triggered Alerts. In this mode, the Alerts widget displays a list of alert notifications; that is, times when an alert condition you set has actually been met.
Show Alert Schedule.In this mode, the Alerts widget displays the list of alerts you have configured.
To toggle between these modes, click the toggle button, which is the first button on the widget's title bar.
To edit, disable, or delete an alert take the following steps:
Put the Alerts widget in Show Alert Schedule mode.
To edit an alert, double-click on the alert you want to edit, or right-click on it and select "Edit Alert". The "Alert Editor" window will appear. Make the desired changes to the alert's description, filter, or threshold, and click OK to save your changes.
To disable or delete an alert, right-click on the alert you want to disable or delete and select the appropriate item from the context menu.
When an alert condition is met, you can view the cause in a workspace. To do so, take the following steps:
Place the Alerts widget in Show Triggered Alerts mode.
Right-click on an alert notification and select from the menu to view one of the following:
The earliest time that entity triggered the alert.
The most recent time that entity triggered the alert.
That entity's entire history with respect to the alert condition.
A new workspace window will appear with the timeframe and filter preconfigured to show only the entity which caused the alert condition to be met and the timeframe during which it happened.
Important If the workspace window is empty, check to see whether there is significant time skew between the computer running FlowTraq Client and the computer running FlowTraq Server. Also, make sure they are both configured to use the same time zone.
This section describes how to configure the various alert notification methods.
Alert notifications are automatically displayed on an Alert widget on the Dashboard of the user who set the condition. No action beyond setting the alert condition is necessary to enable alert notifications on the Dashboard.
| Tip |
|---|---|
You can configure an Alerts widget to display only alert notifications for alerts above a certain severity. Use multiple Alerts widgets to organize your alert notifications in this way. |
FlowTraq can send alert notifications via e-mail. FlowTraq uses the SMTP protocol to send alert notification e-mails.
Configuring e-mail alert notification is a two-step process. First, an administrative user must supply FlowTraq with the address (or hostname) and port of an SMTP server, and the e-mail address to use in the "From:" field of all outgoing FlowTraq e-mails. Then, each user who wants to receive e-mail notifications must supply the "To:" address to which they would like their notifications delivered.
To configure e-mail notification for the first time, take the following steps:
Log in to FlowTraq as an Administrator.
Click the Preferences button on the Dashboard window's toolbar, or select Edit > Preferences from the menu.
Select the E-mail tab.
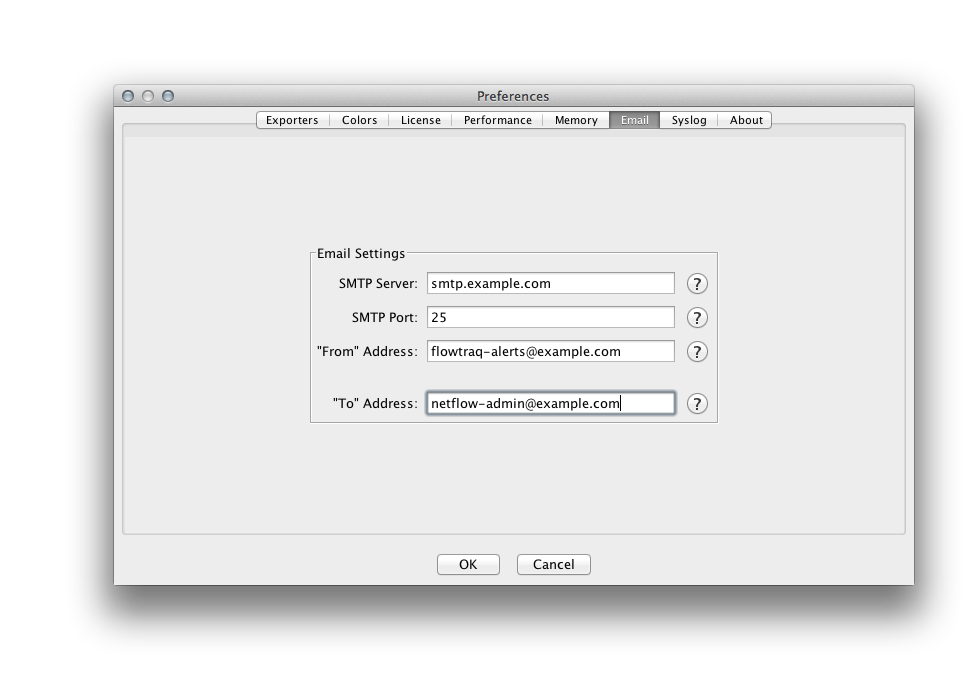
Fill in the address (or hostname) of the SMTP server and the port on which is it listening.
Important FlowTraq does not support SMTP authentication or encryption. Ensure that the SMTP server is configured to allow unauthenticated, unencrypted connections.
Important The SMTP server must be reachable by FlowTraq Server. Ensure that router and firewall settings allow FlowTraq Server to reach the SMTP server at the configured port.
Tip Leave this field blank to disable e-mail notifications system-wide.
Fill in the desired "From:" address.
"From:" Address This address will be used for all outgoing FlowTraq e-mails.
Fill in the desired "To:" address.
"To:" Address This address will be used for all alert notifications for the currently logged-in user only.
Tip Leave this field blank to disable e-mail notifications for the logged-in user.
Click "OK". (A test e-mail will be sent to the "To:" address.)
| Important |
|---|---|
Unprivileged users may access the E-mail preference panel to change the "To:" address for their own alert notifications. However, they may not change the SMTP server, port, or "From:" address. |
FlowTraq can send alert notifications via syslog over UDP in order to facilitate integration with third-party SIEM systems.
To configure syslog notifications, take the following steps:
Log in to FlowTraq.
Click the Preferences button on the Dashboard window's toolbar, or select Edit > Preferences from the menu.
Select the Syslog tab.
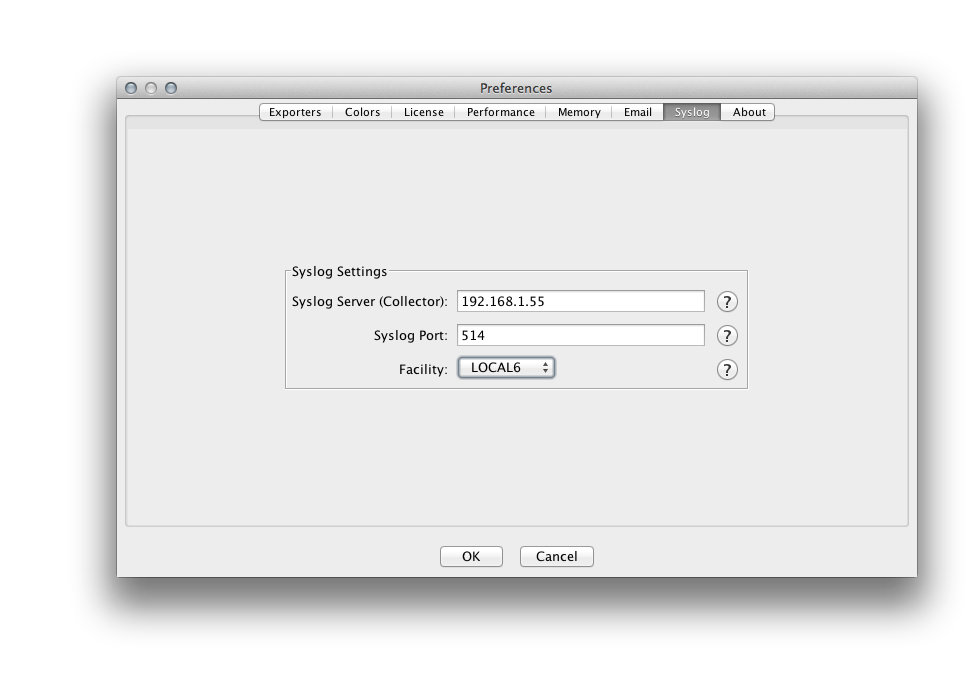
Supply the address (or hostname) of the syslog collector and the port on which it is listening for syslog over UDP. Then select the desired syslog facility.
Important This configuration be used for all alert notifications for the currently logged-in user only.
Important The syslog collector must be reachable by FlowTraq Server. Ensure that router and firewall settings allow FlowTraq Server to reach the collector at the configured port.
Tip Leave this field blank to disable syslog notifications for the currently logged-in user.
Click "OK".
