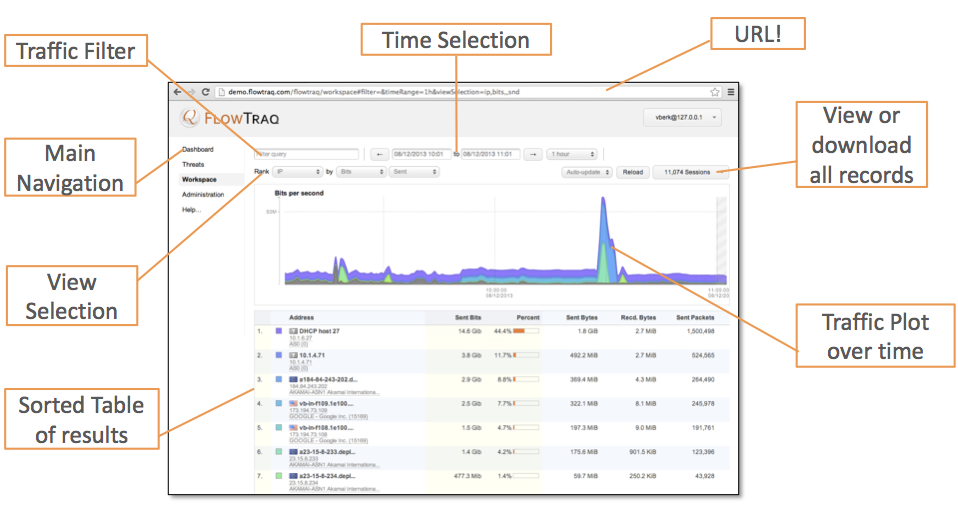
The default FlowTraq user interface is browser based and can be accessed by any Internet enabled device with a web browser. By default FlowTraq can be accessed through the /flowtraq subdirectory on the server. For details on FlowTraq server installation, refer to the Installation Manual.
In FlowTraq the Workspace is your interactive analysis window into the traffic on your network. The Workspace features a powerful filtering interface that enables the analyst to select precisely the traffic of interest. Combined with hundreds of possible viewing combinations, the analyst can observe events on the network from any viewing angle, identifying patterns that remain hidden in traditional network analysis tools. By selecting objects the analyst can quickly pivot, zoom, and focus on suspicous activity, data breaches, and performance issues.
FlowTraq redefines traffic reporting by featuring a full-fidelity database that retains all flow records indefinately. This means you can generate any view of your network, using any arbitrary filter, for any desired timeframe, whenever you need. With FlowTraq it is not necessary to define today what you want to analyze tomorrow, as all reports can be generated on the fly, post-hoc. Since all workspaces are defined in the URL, you can save interesting views of your traffic by bookmarking the URL. Additionally, since each view is generated dynamically, FlowTraq offers arbitrary zoom-in capability with full precision at any timescale.
FlowTraq traffic navigation is defined by 3 key elements:
A filter selecting what traffic is to be ranked. The filter may define exporters, address ranges, protocols, etc.
A ranking view selecting how traffic is to be ranked. Examples of rankings include top addresses by packet count, top exporters by update count, application by total connections, etc.

A timeframe selecting from when to when traffic is to be ranked. Timeframes can be specified in the absolute (date and time), or relative to now (last 3 hours).

Thanks to the full fidelity nature of the FlowTraq database every field of the session record can be filtered on. This includes derived fields such as country and autonomous system number, which are not found in the flow export records, and added by FlowTraq. Since FlowTraq re-assembles uni-directional flows back into bi-directional sessions, many filter options have both a client and a server side, such as ports, traffic groups, and byte/packet counts.
A filter selects which session records will be used to perform the ranking. This means that the filter is applied to each session record in the selected timeframe to decide if the record should be returned and included.
![[Important]](../common/images/admon/important.png) | Important |
|---|---|
Complex filters can be constructed by entering multiple values in a filter line, or by combining multiple filter lines: When entering multiple values in a single filter line they are combined through a logical 'OR' operation, meaning they will use a match any approach. Multiple filter lines can be combined through a match all (logical 'AND') or match any (logical 'OR') approach. |
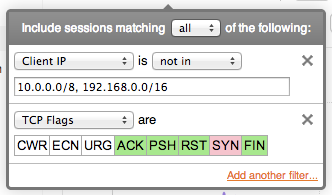
FlowTraq filtering supports definitions of CIDR (classless interdomain routing) blocks in both IPv4 (32-bit addresses) and IPv6 (128-bit addresses). By using the 'slash-size' subnet mask notation, addresses in the entire range are matched. When specifying multiple CIDR blocks, the comma acts as a logical 'OR' in a positive match:
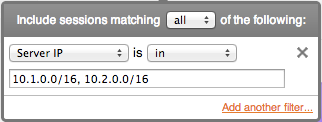
SRVIP==10.1.0.0/16 || SRVIP==10.2.0.0/16
Selecting 'not in' transforms the meaning to a logical 'AND' and negates the match:
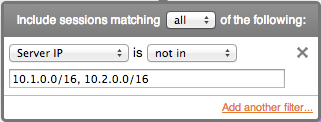
SRVIP!=10.1.0.0/16 && SRVIP!=10.2.0.0/16
FlowTraq supports matching specifically the 'client' or the 'server' side of a session for entities such as IP addresses, ports, autonomous systems, or interface index numbers. For example, this means the analyst can specifically choose to only select sessions where a particular address acts as a server (receiving the connection). When chosing 'either address', all sessions where either the server or the client address match the selected block will be included.
| Important |
|---|---|
When filtering on 'either' only matching entities are ranked. Example: either ASN==32934 will only show FaceBook in the ASN-view, and FaceBook peers in the ASNPAIR-view. When filtering on 'client' or 'server' side entities, all entities in the record are ranked. Example: SRVIP==10.0.1.10 will only any IP that communicated with 10.0.1.10 (including the server itself) in an IP-view |
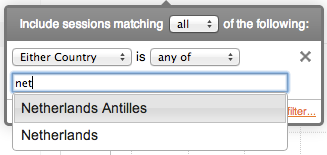
Traffic groups and countries can only be filtered by their name. Simply start typing and they will auto-complete. Application name filtering is also performed by name, but does not support auto-complete.
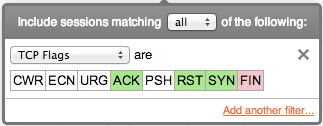
TCP flags are filtered by selecting which flags should be included (green), excluded (red), and don't-care (white). Click a flag multiple times to change the include/exclude status.
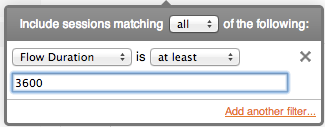
Flow duration is computed from start and end times, and the filter is interpreted as duration in seconds. However: sessions are never longer than the value of the 'toolong' parameter (default is 8 hours maximum).
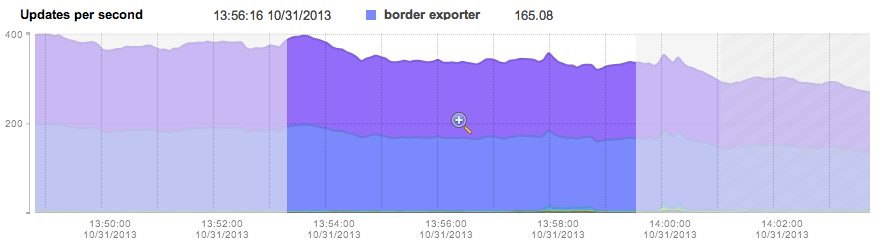
FlowTraq supports a system where the analyst can create arbitrary top-N rankings for any entity found in the session record. A view is created by selecting which entity (such as IP address, netblock, ASN, ...) should be ranked based on what quantity (packets, bytes, connections, ...). Some selections allow the analyst to specify whether only sent, or only received quantities should be included. This example shows a workspace with IP addresses ranked by bits sent. The graph displays the progression of bits sent over time by each of the top IP addresses by color code:
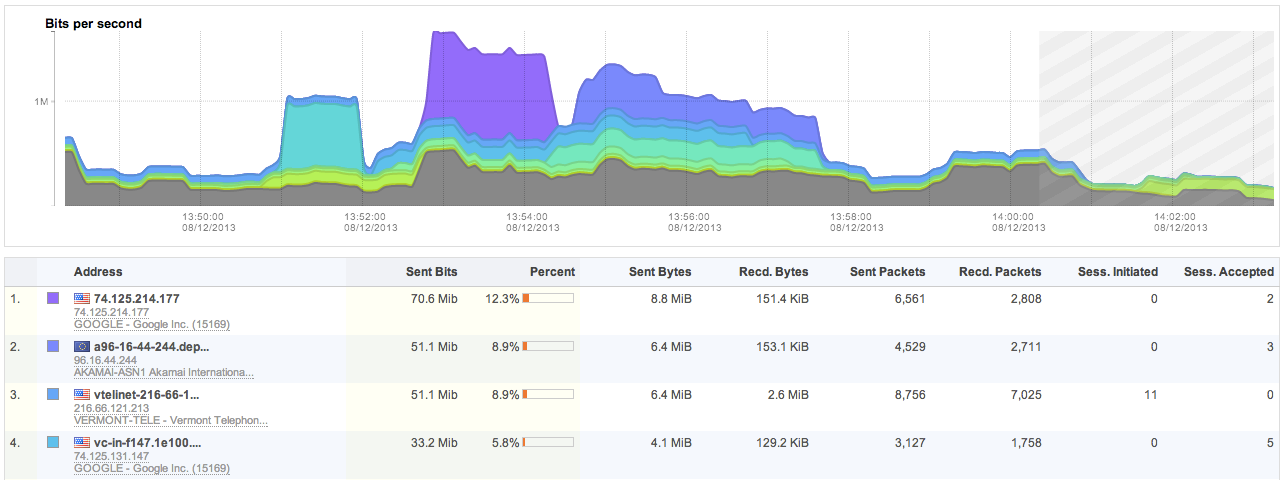
The first column of the table shows the top IP addresses with their reverse-resolved name (if available), and the autonomous system in which the IP address resides. The ranking was performed on bits sent by each IP address. The percentage column displays the contribution of each entity for the total selected traffic based on the filter and current timeframe. The additional columns are auxilary information and cannot be used for sorting.
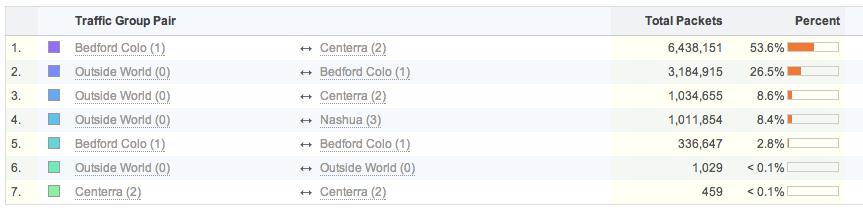
FlowTraq re-assembles uni-directional flows into bi-directional sessions, allowing some entities to be grouped in a pair-wise fashion. IP addresses, interface index numbers, VLAN identifiers, autonomous systems, traffic groups, and MAC addresses can all be ranked in pairwise views. The example image below shows total packets sent between the various FlowTraq office locations and the outside world based on the defined traffic groups:
Ranking of entities can be further controlled to only include bits/bytes/packets/sessions sent, or received. By default both sent and received counts are added into the ranking. By selecting 'sent' or 'received' the analyst is able to control the behavior of the ranking to include include the selected count to or from each entity.
| Important |
|---|---|
Sent/Received differentiation is only available for entities that CAN be viewed in a pairwise fashion, although a pairwise view does not need to be selected. In other words, only entities that are present at each side of a communication (such as IP addresses, autonomous systems, traffic groups, ...) have a meaningful differentiation between bytes/bits/packets sent or received. When viewing accumulated TCP flags, for example, the directionality is meaninless as TCP flags are a property of the communication, and are not tied to either side of the communication. |
FlowTraq offers a wide variety of primary rankings. Some of these are derived from multiple fields in the session record, others are derived from FlowTraq tagged fields:
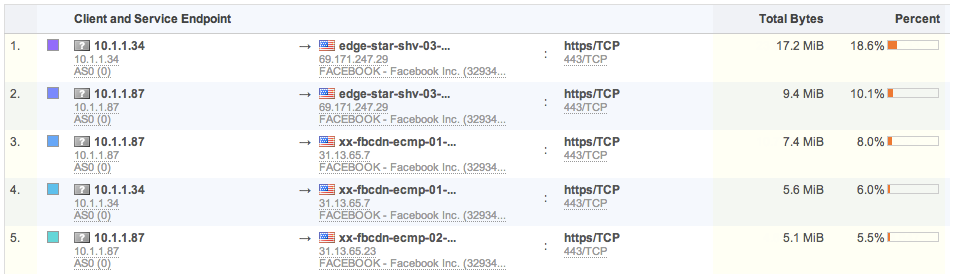
Service Endpoint views: Powerful view combining either server IP and server port/protocol, or client and server IP and server port/protocol. It quickly shows usage of various services in and outside of your network:
Autonomous System views: FlowTraq automatically tags each IP address with the appropriate autonomous system that it belongs to. The ASN views give a high-level macro view of traffic flowing through your network, and common service destinations. Registered names for AS numbers are included and presented in the FlowTraq interface:
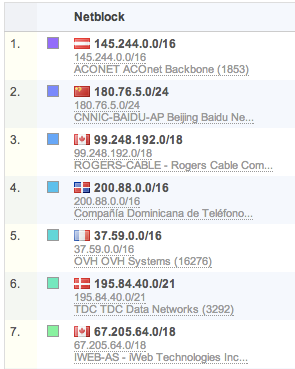
NetBlock views: Similar to AS tagging, each IP address is also tagged with the size of the network CIDR block it resides in. Often this information is available from the exporter. If not, FlowTraq will use the size of the advertised AS block that the IP address is part of. NetBlock views offer another good macro view of traffic patterns.
In addition to regular quantity counts, FlowTraq is also capable of ranking by the unique occurences of other entities. These views only consider the number of uniquely different entities were observed, session and packet counts are therefore irrelevant. Examples:
IP addresses ranked by unique IP peers: ranks each IP address based on the number of unique other IP addresses it communicated with.
Ports by unique TCP flags: ranks each server port by the number of different TCP flag combinates observed.
IP address by unique server port: ranks each IP address by the number of different server ports it has contacted.
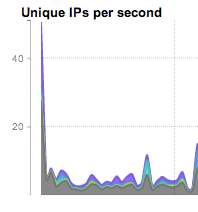
Many different combinations are possible. Unique count views can quickly find scanning and reconnaissance behavior (IP by unique port), and worm spreading and SPAM behavior (IP by unique IP). Note that graphs will usually show an initial spike as the count is performed on first occurrence. This is normal and expected:
FlowTraq offers arbitrary time navigation beacuse data is never aggregated. A history of the most recently received records is kept in RAM for quick query processing. Historical queries are serviced from the disk database, and may take longer to complete.
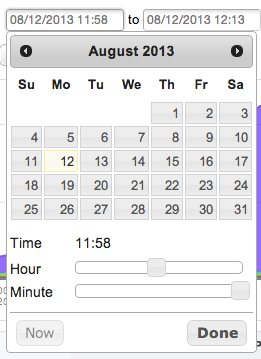
The time navigation bar in the workspace allows for absolute time selection by selecting exact dates and times, as well as relative time selection where the analyst can choose to quickly view the last N minutes or hours. Click on either of the date/time fields to display a calendar widget to select a specific time and date for selecting the timeframe of your query:
Select a data and time using the calendar and the sliders, and click Done when finished:
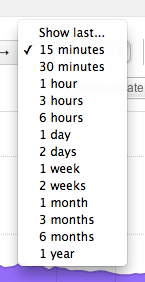
Relative time selection offers the analyst the option to quickly select a timeframe in the recent past up to now. By default the workspace displays a 15 minute view of your network:
After selecting the desired timeframe through absolute or relative time the view can be refreshed by selecting the Apply button at the top right of the workspace.
The time navigation bar displays the timestamps enclosing the currently displayed data. On either side of these timestamps are buttons to quickly move to the previous, or next timesegment of the same length as currently displayed. These Forward/Backward buttons allow the analyst to quickly navigate through the data by viewing the previous or next timeslice with the same view and filter.
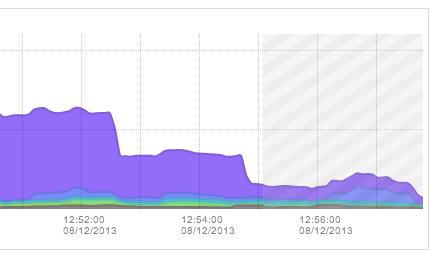
When navigating to a timeframe that includes the current time, or any future time, a crosshatch area will be drawn on the graph indicating the traffic records are yet to be received. The crosshatch area starts at approximately T-2 minutes, indicating that exporters may not yet have reported all traffic records for the most recent timeframe:
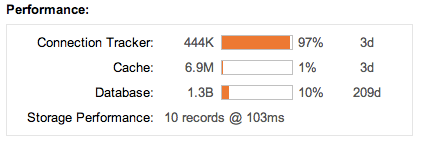
FlowTraq keeps a cache of the most recently received traffic records in RAM memory to facilitate rapid processing of queries in the most recent timeframes where analysts are most likely to be doing interactive work. For timeframes further back in history FlowTraq will query the disk database, which may take substantially longer than a RAM based query. The period for which RAM based queries can be performed is strongly dependent on the inflow rate of flow updates, and the amount of RAM dedicated to the FlowTraq system.
During query processing the icon below the process bar will indicate if the query is being serviced from RAM or from disk:
To analyze how much data is currently held in RAM and how resources are being used please refer to the administration page. The Performance widget displays the current RAM Cache fill (1% below) and the period for which queries can be serviced from RAM (3 days below):
The table in the workspace view will display the first 10 top items. Additional pages with further ranking are available by simply navigating to the next page with the buttons at the bottom right of each table. As the analyst moves through the various pages the graph will change to indicate which data the table is displaying. The workspace displays a top-N style ranking, so each additional data page will have a subsequently smaller contribution to the overall total.
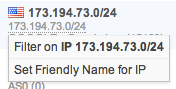
The workspace offers a number of different interactive operations to the analyst, including tagging ranked items with userfriendly names, adding ranked items to the filter to quickly pivot the view, and a drag-to-zoom capability to further drill down on a timeframe.
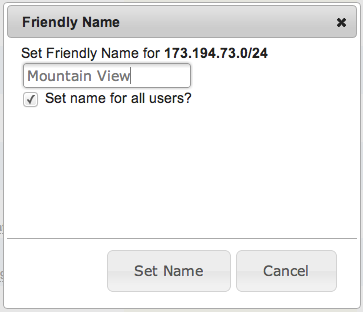
For operator convenience FlowTraq enables the analyst to tag certain items in the ranked view table with userfriendly names. Click on the item and select 'Set Friendly Name' to set or change the display name of the item. Administrative users have the additional option to set the name for all the users. When this option is selected all users will see the name that the admnistrative user has assigned unless the user themselves have assigned their own friendly name to the same item. Primary ranked objects that may be tagged with a userfriendly name:
IP address (including the addresses in IP-pair and Service Endpoint views)
NetBlocks
Traffic Groups
Autonomous Systems (overrides their resolved name)
Server Port/Protocol combinations (including those in the Service Endpoint views)
QoS values
VLANs
Exporter/Interface combinations
By default IP addresses and autonomous system names are reverse-resolved unless a friendly name was assigned. IP addresses are reverse resolved through DNS, while AS numbers are reverse resolved in the FlowTraq server.
Select 'Set Friendly Name' to set or change the display name of the item:
Using the same item menu it is possible to add objects to your current filter, and either focus on their traffic, or ignore it. Keep in mind that a 'match-all' filter combination should be used when working with an existing filter. In pairwise rankings it is possible add either side of the pairing to the filter.
Some items may offer additional filters. IP address items, for instance, will also offer the ability to filter on the autonomous system that the IP address resides in. Adding an exporter to a filter will create two filter boxes: one for the exporter IP, and one for the export protocol version.
When displaying a graph the analyst may select an area of data to zoom in on by dragging the cursor over a section of the graph. When the desired zoom area is selected, a magnifying glass icon will appear. Clicking the icon will re-run the current view and filter on the selected timeframe: