
The FlowTraq Network Behavioral Intelligence (NBI) capability is based on a suite of command-line tools known collectively as the Network Behavioral Anomaly Detection (NBAD) toolkit. The NBI/NBAD design philosophy is to enable, not replace, the analyst: to provide the necessary information for making security decisions, without wasting analyst time on false positives, in order to make the best use of human expertise and judgement. The NBI system leverages FlowTraq's full-fidelity flow storage to produce sophisticated statistical baselines and to make full use of all sessions, regardless of volume or duration.
FlowTraq's alerting is based on "anomaly detection" as opposed to traditional "signature detection" techniques. It makes use of learning algorithms and data history to create baselines for normal traffic. It is a fully-modular system, which both keeps the FlowTraq kernel clean and allows users to customize their deployments to use only the detectors they need, export alerts to any other tools, and even to develop their own interface to the NBI tools.
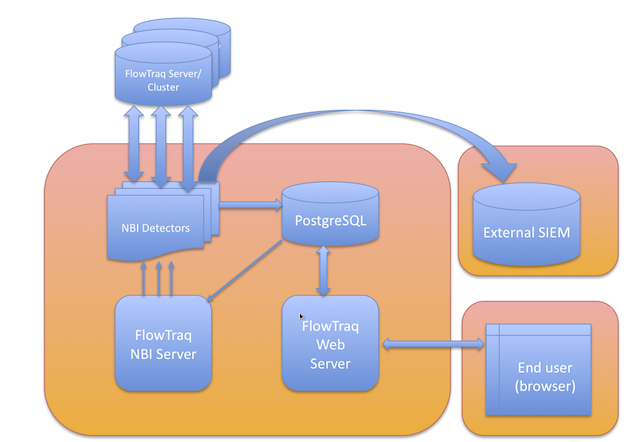
The NBI architecture, including FlowTraq, stretches from flow source to alert consumption. The FlowTraq NBI Server coordinates a set of individual NBAD detectors and a PostgreSQL database. Individual detectors periodically query a FlowTraq server or cluster for recent traffic according to their internal filters and configuration. The resulting alerts from the individual detectors are stored in the PostgreSQL database and (optionally) sent to external collectors via syslog. Stored alerts are also accessed through the FlowTraq Web interface.
Although the NBI system is described above as a whole system, each of the components described can be configured or accessed independently. In particular, the NBAD detectors can be run separately from the command line, even if the rest of the FlowTraq NBI system has not been installed. This makes them available for scripting and manual use on platforms including Windows and MacOS X.
Syslog alerts generated by the NBAD detectors are commonly accessed from Security Information Event Management systems (SIEMs) such as Splunk or ArcSight. (For Splunk users, the FlowTraq for Splunk App provides deep integration of the two products to facilitate quick and intelligent drill-down.) Additional uses of syslog alerts include automated remediation, such as to reconfigure firewalls rules in response to a detected DDOS attack.
FlowTraq NBI as a platform including the NBI Service and database must be deployed and updated independently of the FlowTraq Server upon which it depends. It is frequently deployed on the same host as the FlowTraq Server. FlowTraq NBI requires:
Linux, Solaris, FreeBSD, MacOS X
PHP with process control extensions (pcntl)
PostgreSQL 8.3, or later
Minimum Recommended Configuration: 2 CPUs, 4 GB RAM, 100 GB disk free
In addition to the performance needs of the NBI deployment itself, there are implications for the FlowTraq Server to which it connects. Each running detector imposes a periodic load on the FlowTraq Server that varies according to whether it retrieves raw sessions or requires FlowTraq to perform top-N or similar calculations ('session'-based and 'stat'-based detectors, respectively).
![[Tip]](../common/images/admon/tip.png) | Tip |
|---|---|
Although FlowTraq NBI is frequently deployed on the same host as the FlowTraq Server, licensing allows the NBI suite to run on a separate server without the need for an additional license. |
| Tip |
|---|---|
FlowTraq NBI comes pre-installed on the FlowTraq Virtual Appliance, and can be used with a FlowTraq server deployed on a separate host. |
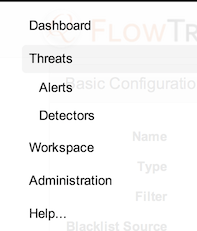
FlowTraq NBI presents a set of detectors built using the NBAD suite of command-line tools. In the following sections, those detectors are described and explained in terms of use through the FlowTraq Web interface. This interface is accessed via the Threats option on the left-hand side menu. Click on Threats to bring up the Threats graph, and then return to the menu to select Detectors.
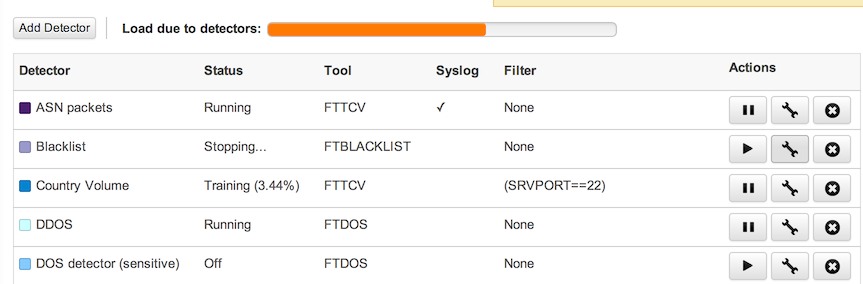
The Detectors page shows all the configured detectors. Detectors may be Running, Off, Stopped, Stopping, or Training. Only Running detectors generate alerts. Detectors that are turned off manually or never started are Off. Detectors with configuration problems preventing correct operation will be Stopped. Training periods vary by detector and by configured training set.
Each running detector adds to the load on the FlowTraq server by its repeated queries. The detector load bar estimates the hit to performance by the number of running detectors according to type. This is only an average: complicated filters, very long blacklists, or the use of "unique count" view types may increase this load, while short blacklists or detectors without filters may decrease it.
![[Important]](../common/images/admon/important.png) | Important |
|---|---|
Stopped detectors should be investigated in the FlowTraq NBI logs, located (by default) in |
![[Note]](../common/images/admon/note.png) | Note |
|---|---|
Users of FlowTraq Q1/14 or earlier may notice that individual users no longer own specific detectors; in order to prevent overlap and forgotten/orphaned detectors, the |
There are three segments to configuring a detector: Basic Configuration, Training (where applicable), and Logging.
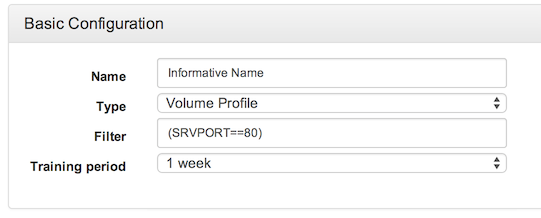
Basic configuration is required for all detectors. Each detector has:
- Name
A descriptive name that will label all alerts generated by this detector, both within FlowTraq and in syslog exporting.
- Detector Type
Select the type of NBAD detector to configure. Options as of Q2/14 are: Blacklist, Threshold, Scan Detector, Volume Profile, DoS/DDos Detector, Behavioral Fingerprint
- Filter (Optional)
Determine the subset of sessions to examine in generating alerts, either to focus on specific portions of your network, or to exclude traffic from consideration either as not of interest, covered by another detector, or likely to cause false positives. IP spaces that turn over frequently, such as WiFi in a workplace allowing employees to bring devices from home, are often poor candidates for IP-based statistical analysis because the same IP can be used by multiple devices over the course of a week.
- Training Period (Where Applicable)
Determine the amount of data to use in the creation of statistical baselines for initial training. All detectors will continue to train during continuous operation, but this value is used on initial startup and on reconfiguration and restart. Longer training periods take longer to start, but provide more accurate results.
Variations on the Basic Configuration panel are addressed according to individual detector below.
Training is required for those detectors that create statistical baselines. This includes the volume detector, scan detectors, DDOS detector, and behavioral fingerprint generator. The training for detectors based on the Volume Profiler contains one or more elements of the following:
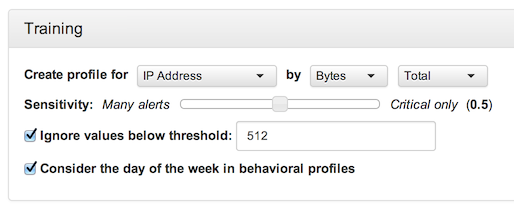
- Entity Type (General Volume Profile Only)
Most items that can be selected for a Workspace view can be profiled as an individual entity. Scan detectors create profiles of hosts according to the number of unique hosts contacted or the number of unique ports contacted. Profiles can be created for QoS levels, individual VLANs, autonomous systems, user-defined traffic groups, and other network entities, according to the normal levels of activity.
- Sensitivity
Statistical analysis of this type never determines a binary "anomalous" or "normal" measure, but rather a degree of statistical confidence. Requiring a high level of confidence ("Critical only") can greatly reduce the number of false positives, but can also prevent the reporting of alerts from entities that are seldom seen.
- Ignore Threshold (Option)
Even when a communication is found to be anomalous, it may be worth ignoring if it amounts to a very small amount of traffic, especially when the purpose of the detector is to identify unusual high volumes, while unusual lows are not of concern. The threshold depends on what is being profiled: for the DOS detector, it is number of sessions (a potential denial of service attack amounting to only 100 sessions may not be worth investigating); for scan detectors it is the number of unique hosts or ports contacted.
- Consider Day of Week (Option)
In many cases, statistical baselines change according to the day of the week, with weekends often showing less traffic than weekdays. Some organizations have particularly busy days, according to their business needs. Seeing Wednesday-level traffic on a Saturday may be cause for concern in such an environment. This option creates a set of sub-profiles according to day of the week, in order to take natural variability into account. Note that this effectively shortens the training period, as there is, for example, only one Monday in a given one-week training period.
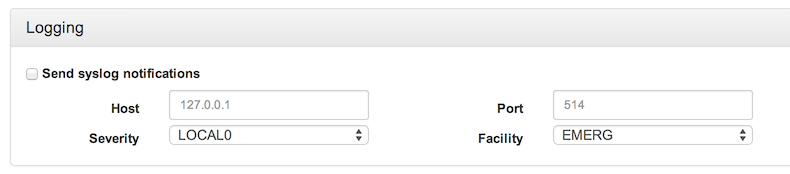
The Logging section is optional. All alerts are fully searchable from the FlowTraq Threats page. Optionally, they may also be sent in RFC5424-compatible syslog format, containing all fields in the structured data section, plus a human-readable unstructured field at the end.
The blacklist detector scans incoming network sessions individually and matches them against a list individual IP addresses and CIDR blocks; each connection to a blacklisted IP or CIDR block results in a generated alert.
The only configuration required for the blacklist detector is the selection of a blacklist. The detector can be configured with the URL of a threat list (from which it will update every 24 hours by default, or at 6- or 1-hour intervals) or with a static text file.
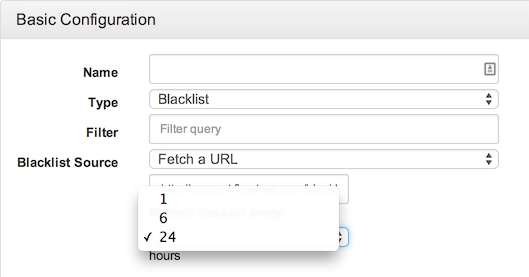
The list source must be a text file formatted in a single column (newline-delimited) of IP addresses, CIDR blocks in [address]/[blocksize] format, or hostnames. Hostnames are resolved automatically, and include one-to-many resolutions (e.g. www.google.com). An example, from FlowTraq's curated blacklist, follows:
	101.80.0.0/12
	103.11.54.35
	103.11.74.118
	103.23.201.219
FlowTraq's list, which is available here, is compiled from a combination of sources and from FlowTraq's own observations, and is updated periodically as new threats emerge. The blacklist detector can also be configured to use lists from third parties, such as ZeuS Tracker, or Emerging Threats -- there are many free and paid IP reputation lists that can be used directly or adapted for use.
Alerts generated by the blacklist detector are timestamped and indicate both parties to the communication involving a blacklisted host, and which party initiated the connection.
| Tip |
|---|---|
Although the blacklist detector is called a blacklist detector, at heart it is simply a connection monitor. It can be used in any situation where a fast notification of traffic is desired, particularly in combination with very specific filters to target the most sensitive network assets. |
The threshold detector monitors short-term traffic for increased volume according to any countable object: hosts, autonomous systems, applications, TCP flag combinations, even entire countries. In its simplest form, it monitors the selected counted object type in terms of bytes communicated (both sent and received) and alerts when that traffic volume rises above the selected threshold within a given ten-minute period.
It can also, however, be configured to count new sessions, or uniques. Either of these can be used to detect various brute-force and scanning behavior, such as by counting unique hosts contacted or unique port/protocols used, or alerting on number of SSH sessions initiated.
The threshold detector can also be used, with a low threshold, to monitor critical systems. For example, it can be configured to alert on any connections to a web server on ports other than 80 and 443. The threshold could be as low as a single byte, or more than a single packet returned by the server.
Host scans (where multiple hosts are contacted in rapid succession) and port scans (where one host attempts a large number of ports in succession) are very common use-cases, including combinations of the two. Although simple scan detectors can be built using the threshold detector, often additional intelligence must be brought to bear to take into account normal behavior that can look like scanning, in order to reduce false positives.
In contrast to the strict ruleset of the threshold detector, the scan detector monitors traffic over time to create a statistical baseline. This can take day of the week into account (this means that it is more sensitive to days of the week where traffic is usually lower, such as the weekend) and can exclude very short sessions, such as DNS traffic or incomplete connections.
The scan detector is useful both as a defensive measure and for compliance: it detects both threats against the monitored network, while also helping ensure that one's network is not a source of trouble for others.
The volume detector is a powerful general statistical analysis tool, that examines long-term traffic history to create baselines for specified network entities -- which could be hosts, applications, autonomous systems, or even whole countries -- in order to be able to quickly identify unusual volumes in terms of bytes, number of sessions, or unique counts.
The volume detector works by creating a series of ranked entity reports and using these to estimate what is normal for each entry. The entity type being scrutinized is defined by the "View" selection: a view by top IP would result in profiles for individual IP addresses. A view by top country would result in country profiles; a view by top port/protocol in port/protocol profiles, etc. The countby selection determines the metric for volume: traditional volume detection would be bytes or bits, but volume can also be measured in terms of sessions initiated or received, or unique counts such as unique ports/protocols used. Such a detector would be useful, for example, in determining whether a host has suddenly started receiving communications over a larger set of applications (essentially the inverse of a port scan) a useful way of detecting distributed scans or deployment of new applications on critical servers.
The volume detector is the most flexible tool in the NBI toolkit, and is often put to creative use by analysts. Any entity type (IP, ASN, VLAN, TCP flag pattern, etc) can be tracked, using any quantity (bytes, sessions, unique entity count) and in conjunction with any filter. Experimentation with the volume detector is frequently rewarded with new insights into network behavior.
The FlowTraq DoS and DDoS detector is a specialized volume detector tuned specifically to identify unusual volumes of very short sessions. Simple threshold detectors frequently fail in these tasks because the network landscape changes over time. The DOS detector, like the volume detector, uses statistical baselines to determine normal traffic levels in terms of number of sessions initiated, regardless of size or duration. In this way, the detector learns typical connection counts for pairs of addresses. If connection counts are observed to significantly exceed the expected count for any pair of IP addresses, an alert is generated.
The DoS/DDoS detector, like the scan detector, is useful for both defense and being a good Internet citizen: detecting participation in DDoS attacks as well as incoming attacks.
Like any security system, learning algorithms can be gamed by a determined adversary to craft an attack that flies under the radar. However, that gaming process significantly slows down attackers and forces them to expend resources on the attack that they otherwise would not.
The Behavioral Fingerprint Generator is the most general-purpose alert in the NBI toolkit, and is responsible for creating statistical profiles of individual IP addresses in order to identify individual sessions as abnormal. Over time it determines a set of typical connections in terms of client and server IPs and likely applications (determined by service port). Alerts are raised when never-before-seen communications take place: a new host contacted, or an ordinary partner contacted on a new port. This allows the fingerprint generator to function as a network change detector, permitting detection of changes in behavior of individual servers in a way particularly useful for detecting malware and data exfiltration.
The fingerprinting process is data- and time-intensive, and can be verbose (particularly in the first few weeks of operation). It therefore is frequently deployed with filters tuned to focus on critical assets in an organization: file servers, email server, databases, etc.
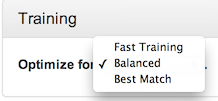
The sensitivity options for the Behavioral Fingerprint detector have significant impact on performance, and are broken down into three options: Fast Training (using fewer resources in exchange for less exact matches), Best Match (prioritizing match quality over resource conservation), and Balanced.
Although the primary method for using the NBI tools is through the Web interface and the NBAD infrastructure, all of the tools are included with the FlowTraq Server installs for all platforms and can be run directly in order to fine-tune configuration parameters, or to construct an infrastructure more suitable for highly-specialized network analysis needs.
The FlowTraq NBI Tools share a number of basic configuration parameters in common with the CLI tools; in particular, the -s, -p, -un, -up, -us, -q, -e, -ei, and -ef parameters all work in the same was as they do with the CLI tools. Use these to specify the FlowTraq Server to connect to, the credentials to use to log in, and more. For more information on these parameters, please see Section 3.2.2, “Retrieving Raw Session Data from the Command Line with ftsq”.
| NBI Tools and FlowTraq Filters |
|---|---|
You can use |
The FlowTraq NBI Tools that learn using network behavioral baselines start by examining a period of historical data. When they are run, they first perform a learning pass over a specified timeframe of historical data (the "training period"), compute baselines, and then begin alerting in real time on the live traffic as it arrives. Specify the training period by using the -tn parameter (to specify a training period relative to now) or using -te/-tl to specify an absolute training period. For more information on these parameters, please see Section 3.2.2, “Retrieving Raw Session Data from the Command Line with ftsq”.
All of the NBI tools support logging network behavior anomalies to standard out or to syslog. To congifure logging, use the following parameters.
Table 3.9. Logging Parameters
| Parameter | Description |
|---|---|
-ls
| Log to stdout (Default: yes UNLESS a loghost is specified via -lh) |
-lh LOGHOST
| Loghost, specify where syslog message are to be sent (Default: syslog is disabled) |
-lp PORT
| Syslog port on the loghost (Default: 512) |
-lf FACILITY
| Syslog facility, one of: LOCAL0-LOCAL7. (Default: LOCAL0) |
-ll LEVEL
| Syslog level, one of: EMERG, ALERT, CRIT, ERR, WARNING, NOTICE, INFO, DEBUG. (Default: NOTICE) |
-lu MESSAGE
| User-defined custom message to be added at the end of the syslog message. Enclose in ""-pair. |
It is often advisible to run multiple instances of one or more of the NBI tools to control alerting channels, priorties, and load balance. You can use -lf, -ll, and -lu to tell instances apart at the log collector. To get the full benefit of the NBI tools, run at least one of each tool.
The FlowTraq Behavioral Fingerprint Generator requires very little configuration. Besides the basic options and the learning period, there is only one parameter to specify.
Table 3.10. ftbfg-specific Parameters
| Parameter | Description |
|---|---|
-bc N
| Behavioral fingerprint complexity index (default: 1, max: 16) |
A higher complexity index generates a better fingerprint, but takes longer to generate. Here is an example of ftbfg output:
	host:nbitools user$ ./ftbfg -s SERVER -un USER -up PASS -tn 4w
	Learning...
	Progress:  | 100.000%  15943 records [....]
	Optimizing behavioral fingerprint...  Complexity 7.81

	10/15/2012 16:14:39.870553 unusual connection
	from 1.2.3.4 to 4.3.2.1 443/TCP

	10/15/2012 16:14:37.707855 unusual connection
	from 2.3.4.5 to 5.4.3.2 123/UDP

	10/15/2012 16:14:36.366546 unusual connection
	from 3.4.5.6 to 6.5.4.3 53/UDP

	10/15/2012 16:14:40.350553 unusual connection
	from 4.5.6.7 to 7.6.5.4 443/TCP

	10/15/2012 16:14:36.365546 unusual connection
	from 5.6.7.8 to 8.7.6.5 53/UDP

	[...]
The FlowTraq DOS Detector requires a few configuration parameters besides the basic options and the learning period. They are:
Table 3.11. ftdos Parameters
| Parameter | Description |
|---|---|
-bg
| Behavioral granularity, one of: WEEK (half-hourly slices), DAY (5 minute slices). Default: DAY. |
-bw
| Time window (in seconds) over which profiles and thresholds are evaluated (default: 600) |
-bt
| Absolute threshold: Suppress alerts below this threshold, by countby (default: 10) |
-bf
| Request frequency, one of: 1x, 2x, 4x, 8x, giving the number of times to query per interval (8x is eight times as frequent as 1x) |
-bd
| Grace period for exporters in seconds (default: 30) |
-bnl
| Only alert on higher-than-expected values. |
-ram
| Maximum RAM footprint (default 32MB) |
| Important |
|---|---|
When using -bg WEEK, the detector runs every 10 minutes, requesting an hour. When using -bg DAY, the detector runs every 2 minutes, requesting 10 minutes. DAY may have up to a 120 second lag between start of attack and the detection, while WEEK has up to a 600 second lag. However, WEEK puts a smaller load on the system than DAY. If DDOS mitigation is a priority, you must run the DOS detector in DAY mode. However, other detectors that do not require immedate automated response may be more accurate in WEEK mode. |
| Exclude Local Addresses |
|---|---|
Consider using a filter to exclude your local CIDR block from the DOS detector if you use automatic mitigation. Or be a good Internet neighbor and block local addresses that are originating too many connections. |
Here is an example of ftdos output:
	host:nbitools user$ ./ftdos -s SERVER -un USER -up PASS
	Learning...
	Estimated iterations: 1.01042
	Progress:  / 100.000%  1737392 records [....]
	Training complete, tracking 4094 entities...

	10/15/2012 16:31:04.446711 DOS behavior detected from
	source 1.2.3.4 to target 4.3.2.1 during 10/15/2012
	16:20:00 to 10/15/2012 16:30:00: 273 connections initated

	10/15/2012 16:31:04.446749 DOS behavior detected from
	source 2.3.4.5 to target 5.4.3.2 during 10/15/2012
	16:20:00 to 10/15/2012 16:30:00: 148 connections initated

	10/15/2012 16:31:04.446760 DOS behavior detected from
	source 3.4.5.6 to target 6.5.4.3 during 10/15/2012
	16:20:00 to 10/15/2012 16:30:00: 101 connections initated

	[...]
The FlowTraq Scan Detector tool accepts the -bg/-bt parameters. Their interpretation, use, and caveats, is the same as in ftdos. Please see the section called “
ftdos
” for more information on these.
Here is an example of ftscan output:
	host:nbitools user$ ./ftscan -s SERVER -un USER -up PASS
	Learning...
	Estimated iterations: 1.00149
	Progress:  - 100.000%  1931638 records [....]
	Training complete, tracking 254 entities...

	10/15/2012 16:32:23.992240 host/horizontal SCAN detected
	from source 1.2.3.4	during 10/15/2012 15:30:00 to 10/15/2012
	16:30:00: 1370 unique hosts scanned

	10/15/2012 16:32:23.992289 host/horizontal SCAN detected
	from source 2.3.4.5 during 10/15/2012 15:30:00 to 10/15/2012
	16:30:00: 275 unique hosts scanned

	10/15/2012 16:32:23.992306 host/horizontal SCAN detected
	from source 3.4.5.6 during 10/15/2012 15:30:00 to 10/15/2012
	16:30:00: 221 unique hosts scanned

	[...]
Table 3.12. ftscan Parameters
| Parameter | Description |
|---|---|
-bg
| Behavioral granularity, one of: WEEK (half-hourly slices), DAY (5 minute slices). Default: DAY. |
-bw
| Time window (in seconds) over which profiles and thresholds are evaluated (default: 600) |
-bt
| Absolute threshold: Suppress alerts below this threshold, by countby (default: 10) |
-bf
| Request frequency, one of: 1x, 2x, 4x, 8x, giving the number of times to query per interval (8x is eight times as frequent as 1x) |
-bd
| Grace period for exporters in seconds (default: 30) |
-bnl
| Only alert on higher-than-expected values. |
-ram
| Maximum RAM footprint (default 32MB) |
The FlowTraq Typical Connection Volume tool is the most configurable tool in the NBI toolkit. Like ftscan and ftdos, fttcv accepts the basic parameters, the training period parameters, and the -bg/-bt parameters.
The fttcv tool also accepts a parameter to specify how many standard deviations away from baseline a measurement must be to alert on. Measurements can be significantly higher OR lower than baseline to trigger an alert, unless the -bnl is used.
Table 3.13. fttcv Parameters
| Parameter | Description |
|---|---|
-bg
| Behavioral granularity, one of: WEEK (hourly slices), DAY (10 minute slices). Default: DAY. |
-bk
| Anomaly threshold: number of standard deviations away from mean (default: 3) to trigger alert. |
-bw
| Time window (in seconds) over which profiles and thresholds are evaluated (default: 600) |
-bt
| Absolute threshold: Suppress alerts below this threshold, by countby (default: 10) |
-bf
| Request frequency, one of: 1x, 2x, 4x, 8x, giving the number of times to query per interval (8x is eight times as frequent as 1x) |
-bd
| Grace period for exporters in seconds (default: 30) |
-bnl
| Only alert on higher-than-expected values. |
-ram
| Maximum RAM footprint (default 32MB) |
Futhermore, fttcv accepts the -grp/-cnt/-snd/-rcv parameters to specify exactly what to measure about what entities. Astute readers may notice that the ftdos and ftscan commands can be approximated with judicious use of these parameters with fttcv.
Here is an example of fttcv output:
	host:nbitools user$ ./fttcv -s SERVER -un USER -up PASS -grp
	HOST -cnt BYTES

	Learning...
	Estimated iterations: 9
	Progress:  \ 100.000%  1612679 records [d...]
	Progress:  \ 100.000%  4183841 records [d...]
	Progress:  / 100.000%  5135777 records [d...]
	Progress:  / 100.000%  7033539 records [d...]
	Progress:  | 100.000%  6527109 records [....]
	Progress:  \ 100.000%  0 records [....]
	Progress:  - 100.000%  0 records [....]
	Progress:  / 100.000%  3674372 records [....]
	Progress:  / 100.000%  1928253 records [....]
	Training complete, tracking 12636 entities...

	10/15/2012 16:50:51.749012 unusually HIGH volume for total bytes
	communicated by address 1.2.3.4 during 10/15/2012 15:50:00
	to 10/15/2012 16:50:00: 1110337644.00
	(u: 1110337644.00 s: 0.00 k: -1.00 n: 1)

	10/15/2012 16:50:51.749193 unusually HIGH volume for total bytes
	communicated by address 2.3.4.5 during 10/15/2012 15:50:00
	to 10/15/2012 16:50:00: 944856533.00
	(u: 152723952.99 s: 331763734.18 k: 11.55 n: 7)

	10/15/2012 16:50:51.749456 unusually HIGH volume for total bytes
	communicated by address 3.4.5.6 during 10/15/2012 15:50:00
	 to 10/15/2012 16:50:00: 938749314.00
	 (u: 167720982.61 s: 352670922.12 k: 11.41 n: 6)

	[...]
The FlowTraq ThreshHold tool is a simple and configurable tool for detecting over-threshold events in any of a number of groupby categories (e.g. IP, IP pair, traffic group, etc), useful for a number of tasks. Common tasks include quick detection of known-undesirable traffic (e.g. SSH traffic from outside the network to sensitive hosts, with threshold >0), for faster detection of high-bandwidth connections regardless of normal level, and similar uses.
Table 3.14. ftthv Parameters
| Parameter | Description |
|---|---|
-bw
| Time window (in seconds) over which profiles and thresholds are evaluated (default: 600) |
-bt
| Absolute threshold: Suppress alerts below this threshold, by countby (default: 10) |
-bf
| Request frequency, one of: 1x, 2x, 4x, 8x, giving the number of times to query per interval (8x is eight times as frequent as 1x) |
-bd
| Grace period for exporters in seconds (default: 30) |
The ftth command accepts the -grp/-cnt/-snd/-rcv parameters to specify exactly what to measure about what entities. Note that in all cases, the confidence level is 100%.
Here is an example of ftth output, which is given in standard syslog format:
	host:nbitools user$ # ./ftth -s SERVER -un USER -up PASS -grp IP -cnt BYTES -bt 10 -bw 10
Learning...
Optimizing behavioral fingerprint...
Training complete, tracking 0 entities...
<133> 2014-09-22T17:04:33.441673-04:00 flowtraq ftth 9411 ftth3 [ftth3@41180 groupby="IP" countby="BYTES_TOTAL" unique="NONE" nbisource="192.168.2.112" starttime="09/22/2014 16:58:00" endtime="09/22/2014 17:03:00" value="1469988" absth="10.00" confidence="100" friendlyname="" CID="0"] threshold exceeded for total bytes/10s communicated by address 192.168.2.112 during 09/22/2014 16:58:00 to 09/22/2014 17:03:00: 1469988 confidence: 100.00 (TH: 10)
<133>	 2014-09-22T17:04:33.441754-04:00 flowtraq ftth 9411 ftth3 [ftth3@41180 groupby="IP" countby="BYTES_TOTAL" unique="NONE" nbisource="192.168.2.117" starttime="09/22/2014 16:58:00" endtime="09/22/2014 17:03:00" value="1439878" absth="10.00" confidence="100" friendlyname="" CID="0"] threshold exceeded for total bytes/10s communicated by address 192.168.2.117 during 09/22/2014 16:58:00 to 09/22/2014 17:03:00: 1439878 confidence: 100.00 (TH: 10)

	[...]
Alerts generated through these detectors can be investigated in three primary ways. First, the raw alerts are collected by FlowTraq and presented on the Threats Report page. Second, the FlowTraq Dashboard offers a set of widgets designed for quick access to summary information from all the alerts generated. Finally, syslog export allows access to FlowTraq NBI alerts from a wide variety of third-party Security Information Event Managers (SIEMs).
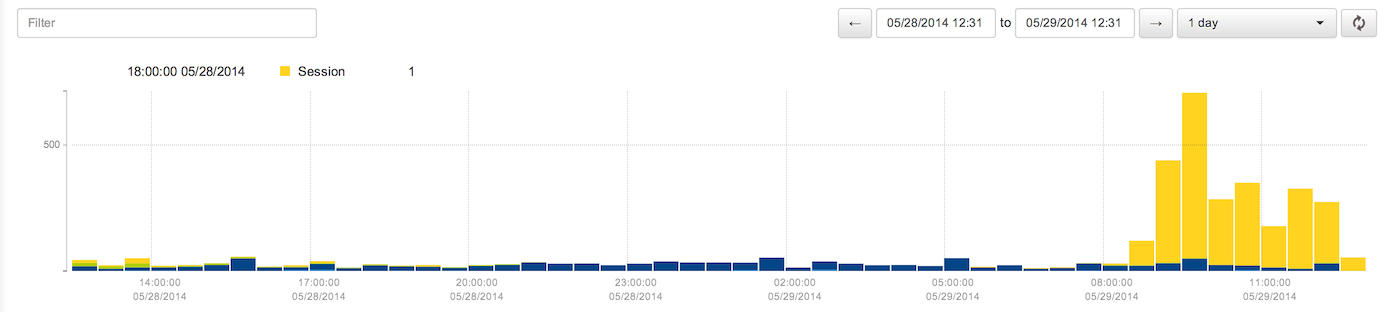
The Threats page is a direct, searchable report of the alerts generated by FlowTraq NBI. In consists of a text filter, a bar graph, a table, and time controls. The text filter performs a search of the PostgreSQL database, updating as you type to show all matching text.
The table under the graph shows the list of alerts that have been generated by active detectors in the selected time frame, matching the text filter (if any). The table contains five columns: detector name, alert details, alert time, expected value (if any), and confidence. Hovering over the table row adds additional information about the alert, including a summary of the reason for the alert and a link to a FlowTraq workspace showing the underlying traffic.
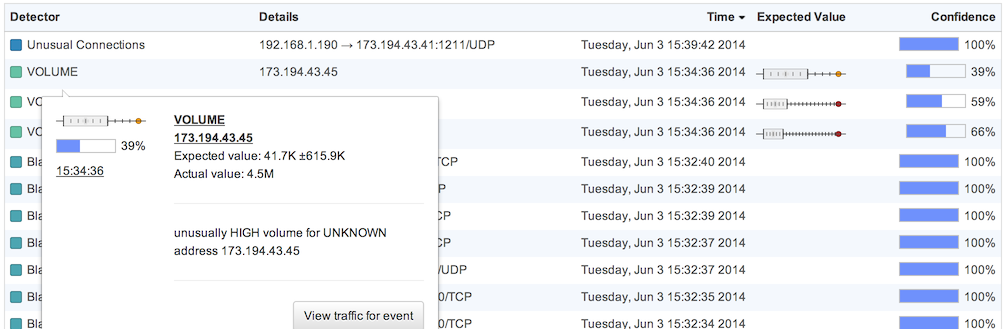
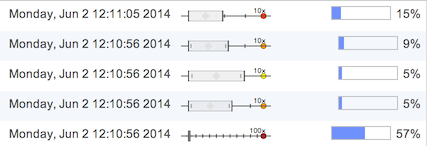
For detectors based on simple rules (blacklist, threshold) or the fingerprint generator (reporting only on new connections) confidence will be 100%. For detectors based on a statistical baseline, the expected value is given as a box and whisker chart, with the expected-normal range shown as a box and the current (anomalous) value plotted with respect to it. The width of the box depends on observed range of values in the training set and in the traffic observed since detector start. Note that the value shown is the value on the day in question, if the baselines take day of week into account. Confidence depends both on the degree of anomaly and on the length of observed data history: the same anomaly will be reported with higher confidence for a host that has been observed for a longer time.
| Note |
|---|---|
Due to the way alerts are stored in PostgreSQL, multiple fields cannot be matched at the same time. In particular, detector name cannot currently be combined with entity. If no alerts match the selected text filter, remove terms to generalize the search. |
In addition to observing the raw alerts, summaries are available in the FlowTraq Dashboard of the top-reporting detectors, and the top subjects of those alerts. In the upper-right corner of the Dashboard, select + Add to add a widget. Drag the New Widget to the desired column (both widgets work well in narrow columns) and configure either Top Threat Sources or Top Detectors.
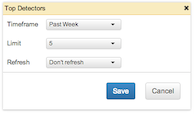
There are three options to configure:
Timeframe limits the number of alerts used to create the list to those raised in the selected period of time. Options are: past hour, past day, and past week.
Limit configures the maximum number of entries shown by the widget, up to 25. This does not include the Total entry.
Refresh determines whether and how often the widget refreshes, in increments ranging from once per minute to once every ten minutes.
These options are the same for both Threat widget types. Refresh rates start from either page load or widget reconfiguration. Often users will create multiple dashboard widgets showing each of past hour, past day, and past week in order to get a sense of how more recent alerts fit into long-term patterns. Large numbers of alerts over a long period of time are useful to see, but can drown out short-term patterns.
- Top Threat Sources
The Top Threat Sources widget combs through all of the alerts in the selected time frame and counts the number of appearances by individual entities -- combining anomalous behavior and policy violations to get a broader security picture and prioritize investigation.

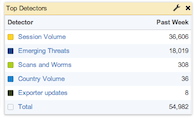
- Top Detectors
The Top Detectors widget assists in detector management by counting the alerts generated by each detector over time. Detectors that are over-reporting may need to be tuned for sensitivity, or filtered to examine a smaller portion of the overall traffic. Comparisons of last hour to last week can be useful for discerning short-term spikes from long-term over-reporting.
All of the FlowTraq NBI detectors can be configured to export RFC5424-compatible syslog events, containing all fields in the structured data section, plus a human-readable unstructured field at the end. These events are consumed by all standards-compliant SIEMs.
In the detector configuration, check the box to export syslog data, and enter the IP address of your SIEM and the UDP port. Select the severity and facility, if either field is used by your SIEM. Only facilities LOCAL0-LOCAL7, for custom logging, are used.
The main part of a syslog datagram is the Message, which is divided into multiple parts: notably, the Structured Data field (containing a list of data in key=value format, and the unstructured Msg text.
Table 3.15. NBI Message Field Components
| Component | Example | Description |
|---|---|---|
Version
| 1 | Version number of output specification |
Timestamp
| 2013-05-24T17:30:46.707092-04:00 | Timestamp in ISO 8601 format |
Hostname
| flowtraq_server | Name of host sending syslog events |
App-name
| fttcv | Name of process generating the syslog event |
Procid
| 20966 | Process ID of the process generating the syslog event |
Msgid
| fttcv2 | Application identifier, including Structured Data format version |
Structured Data
| [fttcv2@41180 groupby="TCPFLAGS" countby="UNIQ_SND" unique="QOS" nbisource="...A...." lowhigh="HIGH" starttime="05/24/2013 16:30:00” endtime="05/24/2013 17:30:00” value="1" u=”0.10" s="0.29" k="3.07" n="14" maxk="3.00" absth="0.00" confidence="6.56"] | Series of key/value pairs detailing the event being reported |
Msg
| unusually HIGH volume for unique QOS/TOS/diffserv connected to by TCP flags ...A.... during 05/24/2013 16:30:00 to 05/24/2013 17:30:00: 1.00 confidence: 6.56 (u: 0.10 s: 0.29 k: 3.07 n: 14) | Human-readable string describing the event being reported |
