
FlowTraq is able to generate alerts in real time based on user-specified conditions, as configured in the FlowTraq Policies page by a user with administrative access. Alerts may include:
Detected denial-of-service attacks (including packet floods, reflection attacks, SYN floods, "poison packet" attacks, etc.)
Threshold-exceeded events in terms of packet or volume rates, or number of new sessions; at the logical (traffic group) or infrastruture (exporter interface) level
Security events including blacklist detections, exfiltration, or scans
When such an alert condition is met, FlowTraq makes that information instantly available in a variety of ways and for a variety of uses, including:
A fully-navigable, filterable alert exporter page
Alert overviews on the policy page, showing at a glance which detectors are triggering for which portions of your network
Alert notifications via plugin, allowing notification via a range of options including email and syslog, or even automated mitigation actions such as notification of DDoS mitigation appliances or scrubbing centers
Auto-refreshing alert summary widgets on the user Dashboard, showing severity counts
Alert retrieval via the command line for scripting
Alerts are tied to partitions, and to either traffic groups or network interfaces. As such, they are governed by the same access rules that control user visibility into raw session data.
This chapter describes how to configure, retrieve, and manage alerts. Alerting in FlowTraq is done by creating Policies, which are rules that describe when FlowTraq generates an alert and what is done with that alert. Policies may be of many different types, applied to Traffic Groups, or to Exporter device interfaces.
Alerts in FlowTraq Q3/15 and later are configured via the Policy page, which is available to view by all users, however only administrative users may interact with the page and configure alerts. The Policy page is found for administrators under the Administration or Detection dropdowns from the top navigation bar, depending on release version.
The policy page shows an overview of the current status of FlowTraq from a rates and alerting perspective, showing the most recent rates at the logical (traffic group) and physical (exporter interface) level, and a security overview in terms of which detectors have been triggering recently. The policy page is viewable by all users, although they may be limited in what they can see according to the partition to which they've been assigned, and the traffic groups that are visible to them.
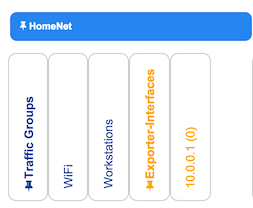
The page is divided horizontally into partitions, and then subdivided into columns representing traffic groups and exporter interfaces. These are shown at the top of the page. Only exporters that are currently sending flows are shown.
Going down the page under the columns are entries for each of the policy definitions. There are seven basic types of detection, each with its own subtypes. To compress or expand sections, click on the triangle next to each major type name. (By default, DDoS subtypes are hidden)
- Threshold/Baseline
These detectors alert based on either thresholds or baseline multipliers at the level of packet rate, bit rate, or new connection rate for traffic groups or exporter interface.
By default, three such detectors are configured: Packets In, Bits In, and New Connections (total)
- Threshold
These detectors alert based on thresholds at the port/protocol level in terms of packet rate, bit rate, or new connection rate for traffic groups or exporter interface.
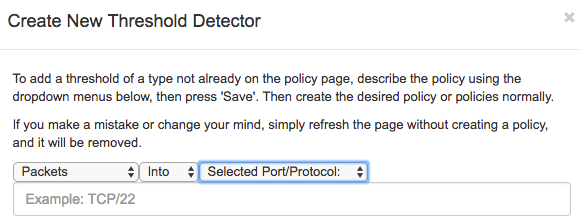
There are a number of common port/protocols and directions available by default. To add another, or to threshold on a different counter (e.g. packet rate out instead of bit rate in) press the blue + button next to the "Threshold / Baseline" and "Threshold" category headers. Select "Selected Port/Protocol", and adjust the units and directional threshold, then select "Save". A new line will be added to the threshold page, which can be used to create new policies. It will disappear on page reload unless at least one policy is added using it, or after the last policy using it is removed.
- Blacklist
Alerts are generated when an IP address in the configured traffic group connects to or is connected to by an IP address on one of the configured blacklists. Blacklists can be configured by administrative users.
- Client/Server
FlowTraq keeps track which hosts in a traffic group have been listed as serving up a given port and protocol, and which remote CIDR blocks have connected to that service. An alert is generated the first time a new service is connected to by a host in a traffic group, and for each new client to that service. Only likely successful connections (the server responds on the port) are included, to cut down on alerts generated by scans.
![[Important]](../common/images/admon/important.png)
Important FlowTraq reassesses this list when it is restarted or upgraded; therefore these detectors can alert frequently on a new install, after a FlowTraq restart, or when new traffic groups are added. Frequently, it is best to only configure alerts by these detectors for sensitive traffic groups. Traffic groups with many dynamically-assigned IP addresses (such as wireless networks) are not generally suitable for this detector.
- Exfiltration
This detector tracks data transfers from inside the selected traffic group to outside the network. Unlike detectors that are based on rate, the exfiltration detector focuses on individual session size in bytes: low-and-slow transfers of data can still be detected even if instantaneous rates are not high. All that matters is that an ongoing session has transferred more than the selected number of bytes.
Important The definition of "outside the network" is by Internal Blocks as defined on the Partition page, and is the same list used for filtering on INT. These should be defined before using the exfiltration detector in most circumstances.
- DDoS
FlowTraq includes two broad catagories of DDoS detection: Packet Flood, and Reflection/Amplification.
In packet floods, a large quantity of data is being sent by one or more attacking hosts to a specific host inside the selected traffic group, typically to a specific port. As sub-categories of the packet flood type, FlowTraq can determine whether the detected attack meets criteria for more specific alerting, including based on TCP flag combination (SYN flood, TCP null, RST flood, XMAS or Christmas tree attack), or is of a particular type (e.g. LAND or poison packet attacks). Even if the subtype is not configured with its own policy or threshold, FlowTraq will still alert if a general packet flood policy is in place.
For reflection attacks, FlowTraq examines large packet volumes according to the apparent source port, which in a reflection attack is indicative of large numbers of sessions involving spoofed IP addresses (in such a case, the attacker is spoofing the victim address in such a way that the victim's routers and switches do not see the request packet, only the response packets). Sub-types are, as with packet floods, detected as long as the parent type is configured, and consist of common port types. Administrators can select thresholds based on their knowledge (and the presented history) of the use of those particular protocols on the network being protected.
DDoS alerts are based on thresholds, but are distinct from the Threshold and Threshold/Baseline types by alerting on traffic levels to individual hosts within a traffic group rather than entire traffic groups.
- Scan/Reconnaissance
This detector looks for large numbers of new connections being made or attempted, either by a local host or a remote netblock, and raises an alert when the total connection count exceeds the threshold given.
The intersection of each traffic group/ifindex and detector is at a single square in the table. A square may represent all traffic groups in a partition (the solid blue columns), all exporter interfaces in a partition (the solid yellow columns), or individual traffic groups or interfaces (all other entries). Depending on detector type, the square shows current rate, and alert status for the last hour. The squares shown below show four entities. In the first row, showing bit rate, the first column is currently alerting, and the second column has no alerts. The second row shows current packet rates for the same entities in the same column (the first column is seeing 2 Kbps of traffic, and 0.7 packets per second; the bps rate has crossed a policy threshold in the last hour.)

The red circle with exclamation mark indicates that there is a policy in place, and that threshold has been exceeded in the last hour. The green circle with a check mark indicates that there is a policy in place, but that the threshold has not been exceeded in the last hour.
![[Note]](../common/images/admon/note.png) | Note |
|---|---|
The policy page does not auto-update. Reload the page for fresh values, including alert counts and current rates. |
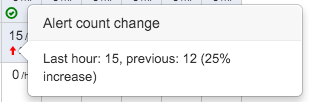
Threshold indicators are shown in the Threshold and Threshold/Baseline blocks. All others display alert rates instead of live data rates. In the example below, the entity has triggered the given alert 15 times over the last hour, which is a 25% increase over the previous hour.

Hovering over the arrow (which may be green if the rate is decreasing) shows additional information.
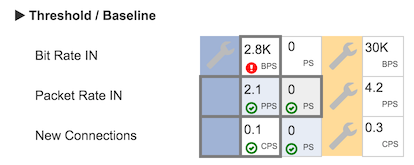
Each square also gives information about whether policies are configured for it, and what type. In the screenshot below, the threshold/baseline block is shown for a partition with two traffic groups and one exporter interface reporting.
There are three basic types of policy configuration, as shown above.
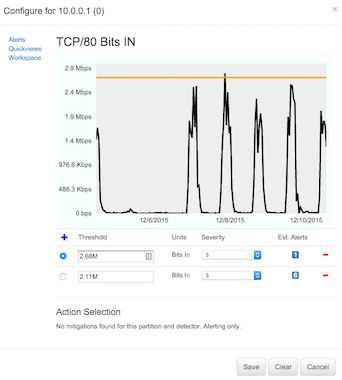
Item Configuration - This is a detection configured for one specific entity, either a single traffic group or a single exporter interface. Item configurations have white backgrounds and dark gray borders, as in the first square in the screenshot (Bit Rate IN, first traffic group, with a current rate of 2.8Kbps)
Template Configuration - This is a detection configured for all entities of a type, either all traffic groups in a partition or all exporter interfaces in a partition. These are identified by a dark gray border in the square in the relevant column (as in the second two rows' traffic group). Templates are inherited by all current and future entities in that partition unless overridden -- entities inheriting the template have light backgrounds of blue or yellow according to type. In the above screenshot, the first column for Packet Rate IN (reading 2.1 packets per second) and the second column for New connections (reading 0 per second) inherit their respective templates.
Muted Configuration - This is an override of a template for a specific traffic group or exporter interface with the special case of turning off alerts for that entity that would otherwise be raised according to the template. It has a gray border like an ordinary item configuration, but also a gray background. In the above example, the second column for Packet Rate in (0 per second) mutes the template.
To configure an alert, an administrative user must navigate to the policy page. Alerting is performed by selecting the intersection of the type of alert (e.g. SYN flood attack, or blacklist violation) as the row, and the entity to apply that policy to, as the column. Each square can be clicked in by an administrative user to bring up a configuration dialog.
The columns represent the entities that can be alerted on, and can be either a traffic group or an individual interface on an exporter. Traffic-group level alerting deals with the network on a logical level, and as a result has more options for detection, whereas interface-level alerting is focused more on operational concerns: primarily traffic volume.
There are two basic configuration pages:
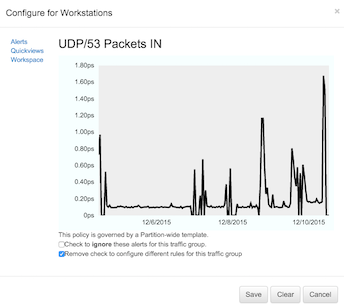
Simple (Boolean) Configuration - This is the configuration interface for blacklist, new client, and new server detectors. These are simply turned off or on by checkbox, as shown below.
Threshold Configuration - This is available for all threshold types, all threshold/basline types, and all DDoS types. These are more sophisticated than the simple enable/disable configuration, allowing for one or more thresholds set by typing in the number fields (accepted values parse standard scale notation and correct for unit: e.g. 1K for 1000 in the packet rate thresholds, or 1K for 1024 in the bit rate thresholds) or by clicking and dragging on the yellow bar indicating the currently-selected threshold.
The graphs shown in these detector configuration popups may include up to three plots: the most recent history of this value (up to a week) plotted in black is shown wherever it is available. The current baseline (selected using the radio buttons to the left of each row in the threshold table below the graph) is plotted in yellow. On detectors for which FlowTraq maintains a baseline of past values, that baseline is plotted in blue, and represents the historical average by time of day.
This type also used, always without a graph, for exfiltration and scan detectors.
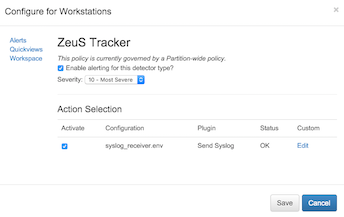
Template detectors are overridden by clicking the square to be overridden. In the configuration dialog, such as shown below, the option is given to mute the template (turn off alerts of this type for this traffic group or interface) or to create an overriding policy.
Each policy (including each threshold in a threshold-type alert) can trigger one or more actions. Actions are individual plugin scripts, which may be downloaded from FlowTraq or a third party. Once plugins have been instantiated (see Administration section on plugins for more information on plugin instantiation) that instance may be triggered as an action. In the figure below, four instances have been created and are available as actions for the selected alert: two email options, a syslog option, and an instance of a local customized plugin.
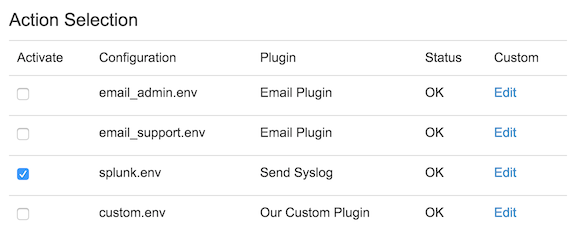
In the above example, only the syslog action will be taken when the given alert is triggered.
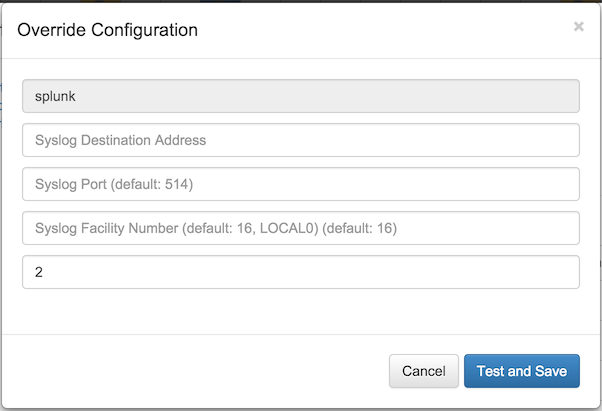
Individual actions may be customized on a per-alert basis by selecting "Edit". In the resulting dialog, a subset of the available options may be overridden. In order to preserve security, the default options are not shown; only the overriding values are displayed. In the example below, the reported syslog severity has been overridden with "2", leaving all other values to their defaults.
Contact FlowTraq support at support@flowtraq.com for further information about plugins.
This section describes how to configure the various alert notification methods. There are two basic notification methods: in-software alerts (either on the Alert page, or through a summary widget), or by triggering plugins to perform actions such as sending syslog, email, SMS, etc. Alerts can also be retrieved via command line scripts for batch processing.
The alert page is the main display and search page for FlowTraq alerts, and can be found in the navigation bar under Detection. This page includes
The displayed page consists of three portions: a navigation bar at the top right, a filter column along the left-hand side of the window, and the details graph and table.
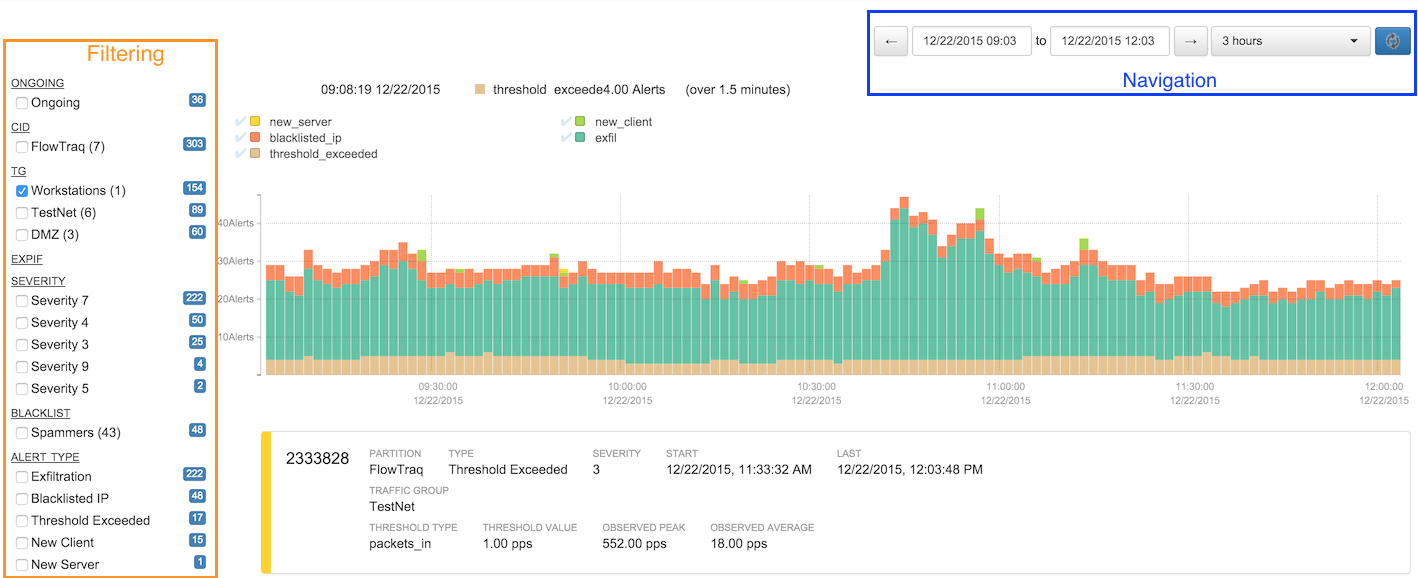
Navigation is performed as in the FlowTraq workspace or quickview pages, by either selecting an abolute or relative time frame from the navigation bar, or by selecting a time frame in the graph by clicking and zooming.
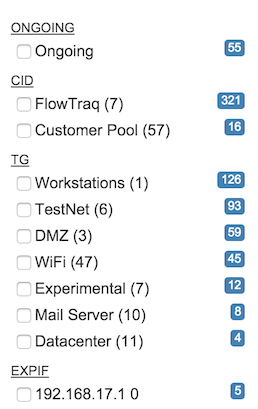
The left-hand filter column acts as both a summary and a filter interface. Next to each entry is a count of the number of alerts in the current selection that match that filter item. These numbers may not add up to the total number of alerts, or may exceed it, as some categories (e.g. "Ongoing" or "Port" may not apply to all alerts) and some ("Traffic Group", "IP Address") may have multiple matches per alert.
The columns are as follows:
- Ongoing
Ongoing alerts are those that have been updated within the last ten minutes; these are the most likely conditions to be ongoing. Even if the time frame does not include the last ten minutes, there may be long-running alerts that are still ongoing.
- CID / Partition
All alerts have one and only one customer ID (CID, or Partition) associated with it; these are counted and shown in this block.
- TG / Traffic Group
Alerting is based on either traffic group or exporter interface as a matter of policy; any given alert may involve up to two, as each address in the session can belong to a traffic group.
- ExpIf / Exporter Interface
Alerting is based on either traffic group or exporter interface as a matter of policy; if the policy is set at the exporter/interface level rather than the traffic group level, then at most one ExpIf will be set per alert.
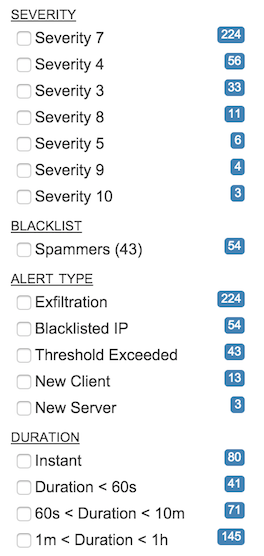
- Severity
Each policy set has a user-defined severity associated with it; the number of alerts in the shown time frame with each severity are shown in this field. Severity 0 is never shown in the list (alerts with severity 0 are considered "muted") but it is possible to have severities above 10 using the command line. These will not receieve a color-code in the main alert list
- Action Status
Policies with configured actions (e.g. email, or DDoS mitigation) cause scripts to be run for alerts generated under the specified conditions. These actions may be stopped, restarted, or manually approved (if the action was configured to not start automatically). The Action Status filter allows the user to select alerts by the current state of associated action. Because individual alerts can have multiple associated actions in distinct states, it is common for the three categories to add up to a count larger than the current number of alerts in view.
Action in Progress matches alerts with actions that have already started, but which have not yet finished. (In plugin terminology, a CREATE event has been generated, but not a DELETE). Action Ended matches alerts with actions that are not currently active, including actions that have been stopped as well as actions that were never permitted to proceed. Alerts with actions marked Waiting for Approval include one or more actions that have been in a pending state since the alert was created, and can be either approved or rejected.
- Blacklist
Items in this list are drawn from the set of currently- or previously-defined blacklists configured in the Administration section, and are identified by the last-defined name of that list. (Alerts are tagged with blacklist ID numbers, and the names are looked up upon alert retrieval)
Note that alerts other than Blacklist alerts may appear when filtering on a given blacklist; these alerts describe further alert conditions involving the tagged hosts.
- Alert Type
Each alert is categorized according to the type of policy that generated it. The current list of possible alert types is:
Blacklisted IP
Threshold Exceeded
New Client
New Server
Exfiltration
DDoS (Packet Flood)
DDoS (Packet Flood)
DDoS (Amplification Attack)
DDoS (TCP NULL)
DDoS (IP NULL)
DDoS (RST Flood)
DDoS (SYN Flood)
DDoS (TCP Zero)
DDOS (XMAS Flood)
DDoS (Land Flood)
Low-and-Slow
Scan (Local)
Scan (Remote)
- Duration
Each alert has a defined start and stop time that determines the period of time over which an alert condition persists; the duration field gives an order-of-magnitude overview of the alerts that occured during or overlapping the selected time period. Alerts up to one second long are considered "Instant" and may consist of single-packet sessions, such as may be seen in blacklist alerts or scans.
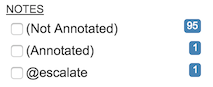
- Notes
Alerts may be (optionally) annotated by any user who is able to view them, frequently to coordinate investigation or mitigation action, or to report the results of an investigation. The Notes filter permits easy identification both of alerts that have not been annotated (including alerts whose annotations have been cleared), as well as extracting text marked with @notation. For example, an annotation "@escalate This looks like a problem" will match the filter "@escalate", which will be automatically added to the filter list.
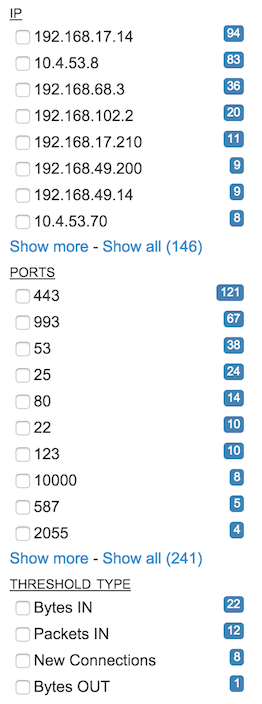
- IP
Some alerts list affected IP addresses, including local and remote addresses. All IP addresses listed in any alert are listed in the IP block, sorted by the number of times each address appears in an alert. By default, only the top addresses are shown; controls are given to show more (ten at a time), or to show all. The full list may be lengthy, especially for long periods of time.
- Port
As with IP addresses, a number of alerts list affected/attacked ports. By default, only the top ports are shown; controls are given to show more (ten at a time) or to show all. The full list may often include client/ephemeral ports, and so may be lengthy.
Note that protocol is omitted, so that selecting "53" will include both UDP and TCP port 53.
- Threshold Type
There are a number of different thresholds that fall under the alert type "threshold" and so a separate list allows for quick counts and filtering on specific type. Those types are
Packets IN
Packets OUT
Bytes IN
Bytes OUT
Bits IN
Bits OUT
New Connections
Total Bytes
Total Packets
Remote CIDR Scan
Local Endpoint Scan
Poison Packets
TCP NULL Packets
XMAS Tree Packets
All filtering parameters, once confirmed by Applying the query, are reflected in the URL, which may be bookmarked for quick reference.
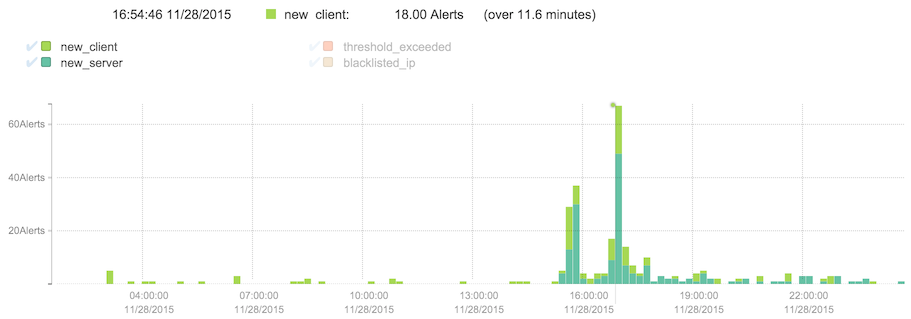
The alert details are shown in the graph and the table. The graph shows a breakdown by alert type over the time frame selected. Each alert matching the current filter is represented in the graph according to its duration, so that a single long-running alert may span the graph, while a very short one may contribute only a spike. The total number of alerts active during each time slice is graphed, color-coded by type.
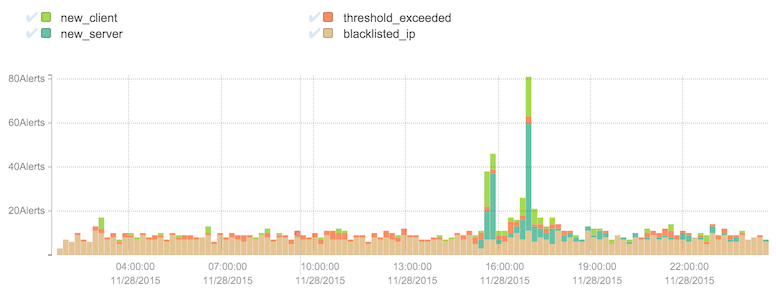
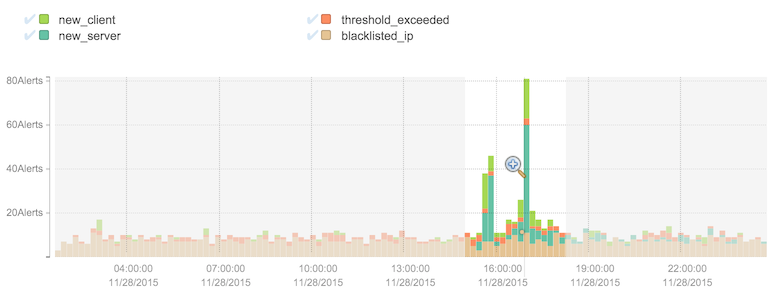
Hovering over each time slice gives further details. In the graph above, for example, there was a short period (11 minutes) during which 81 alerts were active, 11 of which were blacklist alerts, 49, new server alerts, 3 threshold-exceeded, and 18 new client alerts. By interacting with the items in the legend, types can be selected or removed, such as by clicking the check marks next to "new client" and "new server" as shown below.
In addition to navigating using the time selection bar, clicking and dragging in the graph will select an area to zoom in. Click the magnifying glass to trigger the new query.
The scrolling list under the graph contains all of the alerts matching the filter and overlapping the time frame, displaying details of each with a color-coded severity along the left side of the panel. The contents vary depending on alert type and the details of the specific alert, but generally contain a severity, the partition to which the alert belongs, a time range, and an indication of alert type and why the alert was triggered.
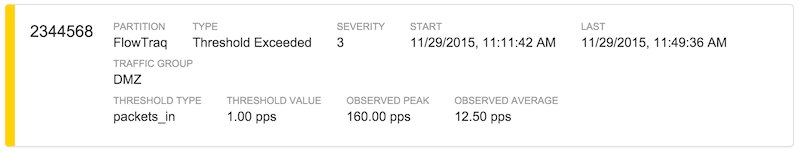
In the figure above, an alert was generated describing a 160 packets incoming per second threshold with severity 3 that was exceeded for a period of 37 minutes. It was generated in the partition named FlowTraq in the traffic group DMZ. Clicking anywhere in the alert panel brings up a more detailed summary of the alert itself, along with a pre-formatted workspace link to investigate further in the full-fidelity environment.
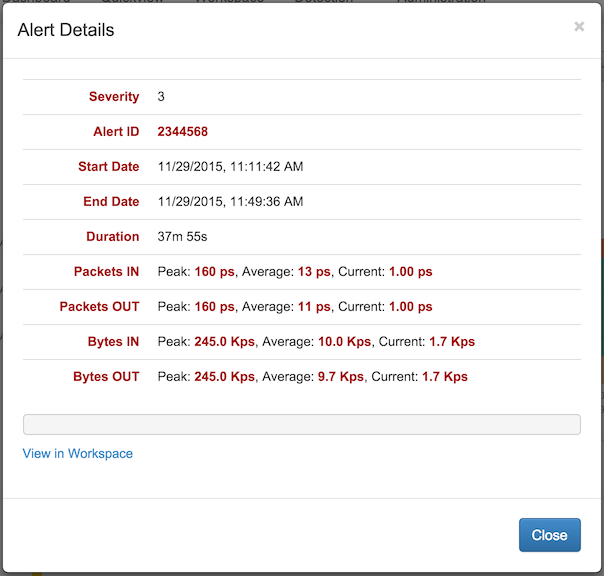
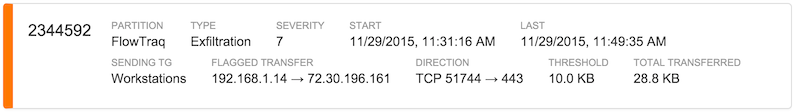
Displayed information varies according to the individual alert and its circumstances. Threshold alerts are typically reported on the basis of the traffic group or exporter on which the policy was set. Security alerts such as exfiltration, scan, or blacklist will list pertinent information about the identities and protocols involved. In the exfiltration alert below, the total amount of data transfered over the course of the offending session is displayed.
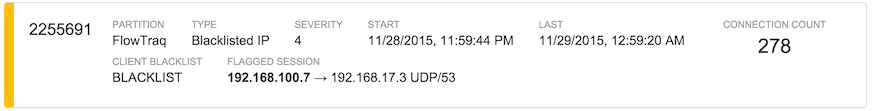
Further information may also appear on the right-hand side as a way of visually augmenting the severity indicator, as in the blacklist alert below, which shows a large number of distinct connections from the blacklisted host.
Alert notifications are displayed in an Alert Summary widget on the Dashboard of the user who set the condition. No action beyond creating the widget is necessary to enable alert notifications on the Dashboard. The summary widget shows the number of alerts generated over the selected time frame, organized by alert severity, from 1 to 10.
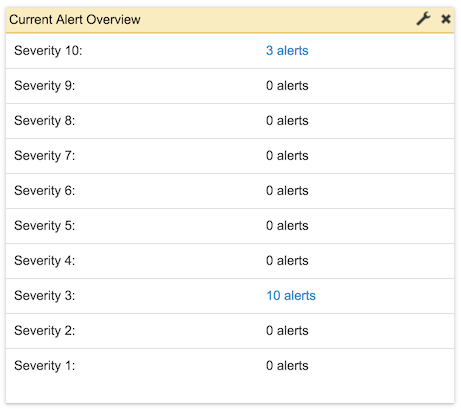
Every non-zero count in the widget is a pre-populated link to the Alert page, to view all of the alerts in the given time frame that have the severity shown. Note that the link will always show, for example, the last 30 minutes, so that a stale Dashboard (for example, a widget that is not auto-refreshing, or is refreshing slowly) may be out of sync.
| Important |
|---|---|
The command line interface (CLI), including the time selection syntax, is described in detail in Section 3.4, “Command Line Interface”. |
FlowTraq notifications can be retrieved via the CLI. This allows you to tie arbitrary scripts to each alert as it is raised. To do this, take the following steps:
Using the Policy page, define alerts based on the conditions that you want to act on. (Note: It might make sense to create a dedicated user for scripted alerts.)
Retrieve the list of recent alerts by using the
-alertparameter with the alert and policy command line toolftnbi. For example,/opt/flowtraq/clitools/ftnbi -s flowtraq.example.com / -un alertuser -up MASKED -alert -tn -3m -j
This command connects to the FlowTraq Server at
flowtraq.example.comas useralertuser. The-tn -3mrequests all the alerts generated for this user in the last 3 minutes. The -j switch specifies that alerts are to be retrieved in JSON (JavaScript Object Notation) format (currently the only supported format).The output of this command will look similar to this:
[
	{
	  "version" : 1,
	  "earliest_utc" : 1449177843.491220,
	  "latest_utc" : 1449177843.491220,
	  "id" : 1004,
	  "CID" : 0,
	  "severity" : 3,
	  "alert_type" : "ddos_slow",
	  "target_ip" : "10.2.0.25",
	  "target_mask" : 0,
	  "target_tg" : 1,
	  "proto" : 6,
	  "server_port" : 62160,
	  "sources" : [ "23.32.0.0/12", "52.0.0.0/8", "54.0.0.0/9", "107.21.128.0/17", "54.163.240.0/24", "54.192.48.0/24", "23.72.0.0/13", "17.128.0.0/9" ],
	  "total_sources" : 32690,
	  "threshold_value" : 100.00,
	  "current_values" :
	  {
	     "packets_in" : 3.50,
	     "packets_out" : 6.25,
	     "bytes_in" : 4361.75,
	     "bytes_out" : 1857.25,
	     "new_conn" : 0.25
	  },
	  "peak_values" :
	  {
	     "packets_in" : 3.50,
	     "packets_out" : 6.25,
	     "bytes_in" : 4361.75,
	     "bytes_out" : 1857.25,
	     "new_conn" : 0.25
	  },
	  "average_values" :
	  {
	     "packets_in" : 3.50,
	     "packets_out" : 6.25,
	     "bytes_in" : 4361.75,
	     "bytes_out" : 1857.25,
	     "new_conn" : 0.25
	  }
	}
]
The alert gives direct details of the alert, including the time frame, the type of alert ("ddos_slow", above, indicating a low-and-slow type application-layer attack), the partition (as "CID"), and affected traffic groups, IP addresses, and ports.
Write a script that consumes the above format, parses out the details you need to guide your action, and takes your desired action. Any programming language that parses JSON-formatted data (including Javascript, of course, but also PHP, Python, and other languages) will
Set your script up to run according to a regular schedule (by using
cronor similar) as often as you need it to. If your script runs every minute, use-at 1mto retrieve the alerts notifications active in the last minute; if it runs every hour, use-at 1h; and so on. There will be some overlap from one time frame to the next, as a single alert may be active for long periods of time.
