
This section is intended as a quick way to get started with FlowTraq once it's set up. It will guide you through the first steps of viewing flow data and getting alerts on potential trouble conditions.
Before proceeding with this section, you should have:
An active FlowTraq account -- for example, the default
adminaccount, with the default passwordadmin.At least one flow exporter sending NetFlow, IPFIX, J-Flow, cflow, or sflow to your FlowTraq install (see the section below on verifying exported data)
When you log into FlowTraq, the first page that loads is your Dashboard. For now, it contains two "widgets" (small self-contained, auto-refreshing data panels): a "Welcome" message, and a graph of your top exporters over the last 24 hours.
The Navigation bar will be at the top of your screen, and includes links to all the portions of FlowTraq: The Dashboard, the Quickviews, the Workspace, as well as the pages related to Alerting and to administering your FlowTraq install. This bar appears on all pages. At the upper right is a dropdown with your username in it. Clicking this will give you access to the preferences page (where you can change your password, among other things), a link to this manual, a quick mailto link for FlowTraq Support, and the option to sign out.
The first thing to do is to verify that your data is arriving in FlowTraq. On your Dashboard will be a Top Exporters widget. Ordinarily, it should have a graph in it showing data rates from one or more of your exporting devices, as below.
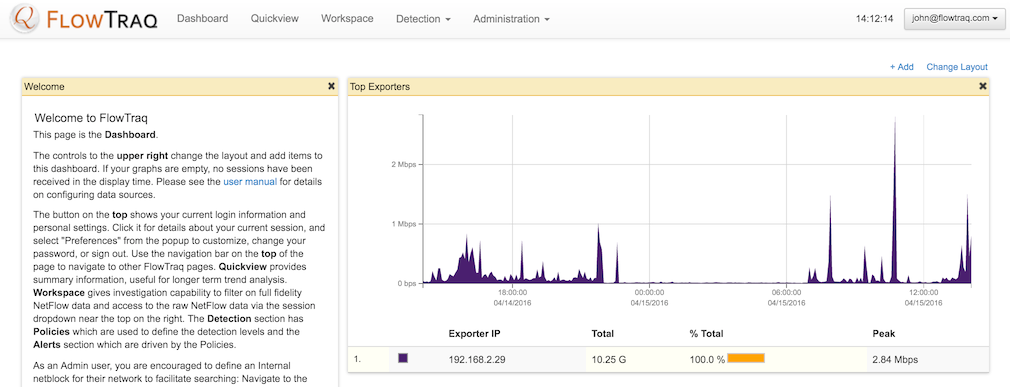
If that widget, instead of showing a graph, shows an error or the words "No data to display." then your flow data is not arriving at FlowTraq. Check these things:
Your router is correctly configured to send NetFlow data to your FlowTraq install on one of: UDP/2055, UDP/9666, UDP/9996, or TCP/4739; or is configured to send sFlow data to FlowTraq on port UDP/6343. It may take up to 30 minutes for flows from some devices to correctly appear in FlowTraq, due to the rate at which template information is sent by those devices.
![[Note]](../common/images/admon/note.png)
Note Some devices will only send flows to one collector, even when multiple collectors are configured. In such a case, tools such as samplicator can be used instead to send flows to multiple destinations.
The FlowTraq install IP is reachable from your flow exporter. Check firewall settings as well.
If you have verified router configuration, but flows are still not arriving, please contact FlowTraq support. If flows are appearing, but the volumes are unexpectedly low, please check the following:
All expected routers are configured for flow export
All necessary interfaces on those routers are configured for flow export, including where necessary both ingress and egress monitoring.
Routers are not unexpectedly sending sampled flow records.
Note The NetFlow 9 and IPFIX standards require sampled flow exports to be accompanied by datagrams describing the sampling rate so that the flow collector can statistically reconstruct the session volumes; some devices have been observed to deviate from that standard. In such cases, flow volumes will appear abnormally low.
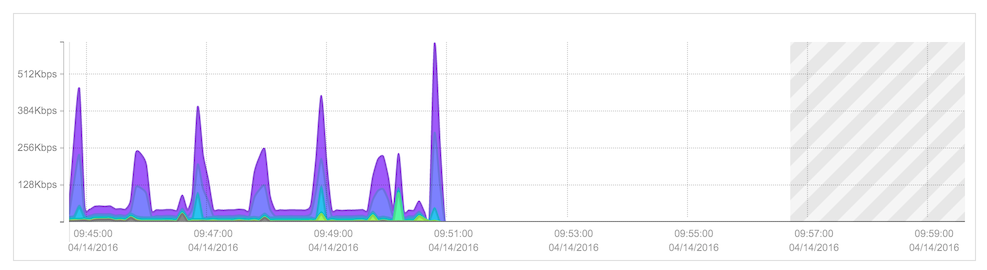
Once you see data appear on the Top Exporters graph on your Dashboard, it's time to verify that the data is also available in the full-fidelity workspace. Simply select 'Workspace' from the Navigation bar, and you will see a graph of the last fifteen minutes of live data. Take a moment to verify that data is appearing in the graph. A short gap in data at the far right side of the graph (in or near the shaded region) is normal, but a lengthy delay (such as shown below) or an empty graph is frequently a sign that the router is not tagging flow records with the correct time. In such a case, verify that the exporting device's calendar (or hardware clock, depending on device) has the correct time and time zone, or that NTP is correctly configured.
The next thing to do is to tell FlowTraq a little more about your network, by defining Traffic Groups. A Traffic Group is a collection of IP addresses or netblocks. Often, these are the addresses that belong to you, organized by how they are assigned, but sometimes they may be external addresses or ranges that are important to your network operation (e.g. off-site backups, partner sites, etc.) These groupings form the basis of alerting policy for FlowTraq, and for long-term trend analysis, and they also provide a convenient granularity between the netblock and autonomous system level when examining your traffic. Typically, the RFC 1918 range (192.168.0.0/24, 10.0.0.0/8, and 172.17.0.0/12) will be added as a Traffic Group, if nothing else, but it is frequently useful to describe your network more specifically than that -- for example, to denote different physical locations, or important servers.
Each flow record received by FlowTraq is annotated with one Traffic Group per side of the conversation. When host 10.0.0.1 makes a connection to host 10.0.0.2 on port 443 from some ephemeral port (e.g. 10.0.0.1:34567 → 10.0.0.2:443 (TCP)), FlowTraq looks up each host (and, if appropriate, the port on which the communication took place) and adds an annotation to each address denoting which (if any) Traffic Group it belongs to. (e.g. 10.0.0.1:34567 ["Workstations"] → 10.0.0.2:443 ["My Web Servers"] (TCP)) Each address receives only one such annotation, according to the most specific rule. This is explained in further detail in the manual section on Traffic Groups.
![[Important]](../common/images/admon/important.png) | Important |
|---|---|
If the Administration dropdown is not in the Navigation bar, then you are not logged in as an administrator of your account. The first account created for you by default is |
Navigate to the Traffic Group page via the top Navigation bar. Here, you can edit existing Traffic Groups, or define new ones. Let's define a new one. Click the blue "Create a New Traffic Group" button at the bottom of the page.
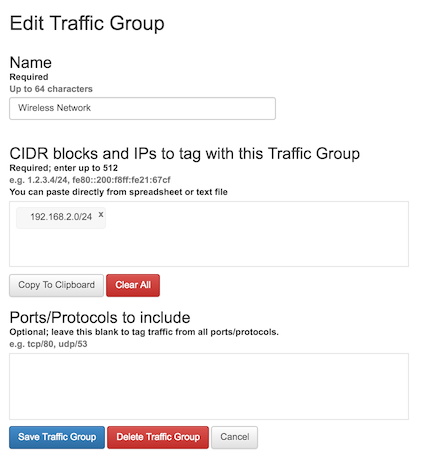
This page gives you an interface to create new Traffic Groups. In the screenshot above, the "Wireless Network" traffic group was defined by simply typing "192.168.2.0/24" into CIDR blocks and IPs box. Hitting space, enter, or a comma between blocks or IPs, or clicking outside the entry box, triggers FlowTraq to check the address you entered for validity. (Validated IPs/blocks can be removed by the 'x' in the corner of the gray box in which they appear) Lists of blocks and IPs can be pasted in from a file where they are delimited by commas and/or whitespace.
Press the "Save Traffic Group" to save the definition. From this point forward, any new flow that arrives will be tagged according to the new definition. Ongoing sessions (such as long-running downloads) or sessions that have already finished will not be affected.
Now that traffic groups have been created, FlowTraq will begin keeping long term histories on their traffic patterns. These will be stored for the life of your FlowTraq account, and will still be accessible if you delete these particular Traffic Groups. They will also now become available for alerting, which is explored in the next section.
With traffic data being received and at least one traffic group created, you can create policies to determine when FlowTraq generates alerts, and how it notifies you. There are a number of different alert types, described in more detail in the alert policy, and the specific policies will vary from use to use, but the goal here is to go through the steps of creating a policy to detect potential SSH brute force attacks, and (optionally) removing it again.
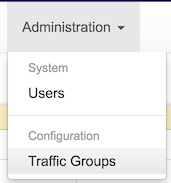
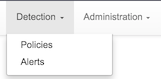
First, navigate to the Policy page via the Detection dropdown in the Navigation bar.
Across the top of the policy page are the Traffic Groups that you currently have defined. Each has its own column in the table below, along with one solid blue column representing all Traffic Groups. Each of the rows specifies one specific policy type, for example thresholds on incoming bit rate to a Traffic Group, or Blacklist detectors. The intersection of each row and each column represents a policy: a detector type in combination with a Traffic Group to alert on.
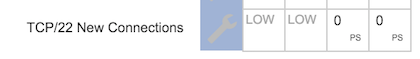
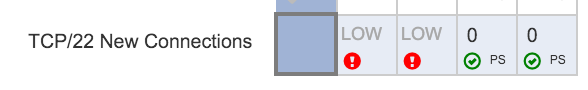
First, look at the top block of detector types, showing bit rate, packet rate, and new connection rate. When you loaded the page, the current rates into those traffic groups were put into the boxes. For the Policy page, FlowTraq keeps track of the overall rates into the Traffic Groups, as well as the top ten port/protocol combinations. Any port/protocol combination not currently in the top ten is listed as "LOW" in its respective square.
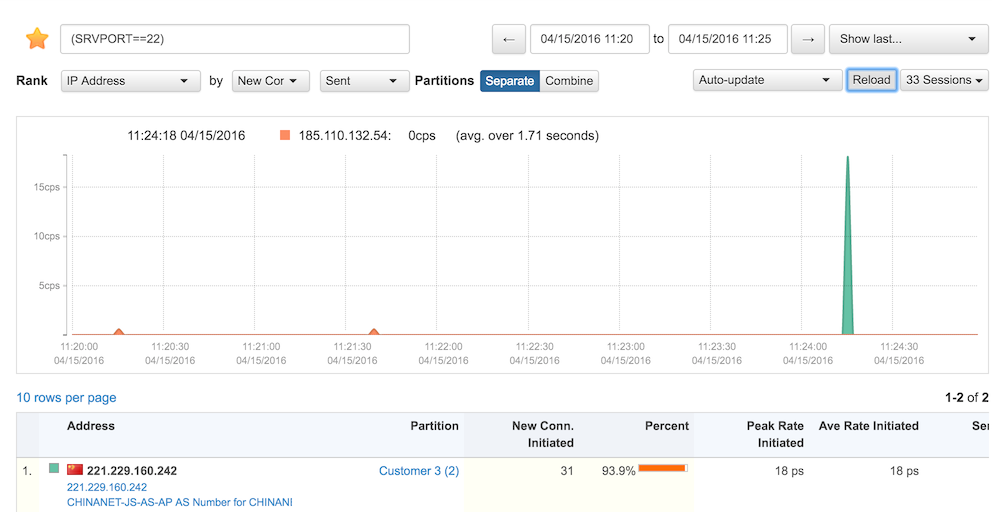
To detect potential SSH brute force attacks (either incoming or outgoing), we want to know when a large number of new connections are being made involving a Traffic Group on on TCP port 22. The type of behavior we would like to detect is shown in the workspace graph below, displaying a typical short-term brute force attack -- in this case, a horizontal scan of a subnet looking for open SSH ports.
On the policy page, find the row marked "TCP/22 New Connections", and click the blue square containing a wrench icon.
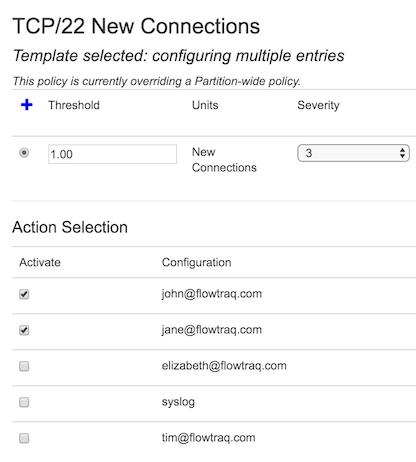
A window will pop up showing a number of options. We are configuring a policy for all Traffic Groups, present and future. This can be overridden for individual traffic groups later, if desired.
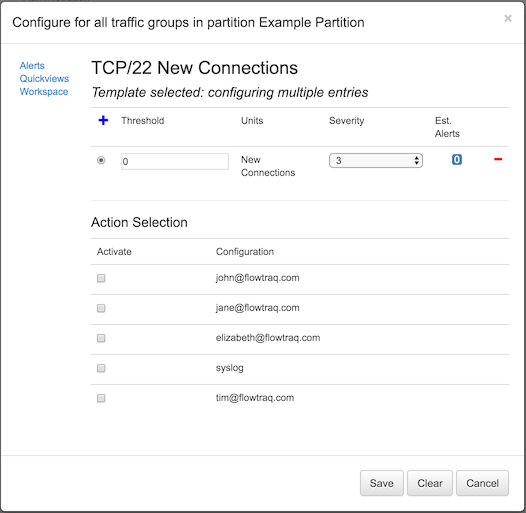
For networks with ordinary SSH traffic, incoming new SSH attempts tend to be rare, comprising a very small number of actual new connections made. In the example below, we've set the threshold rate to 1 connection per second, with a severity of 3.
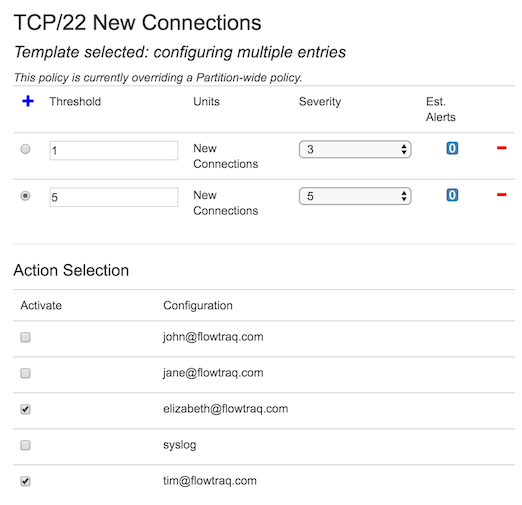
We could optionally add a second, higher threshold, as shown below.
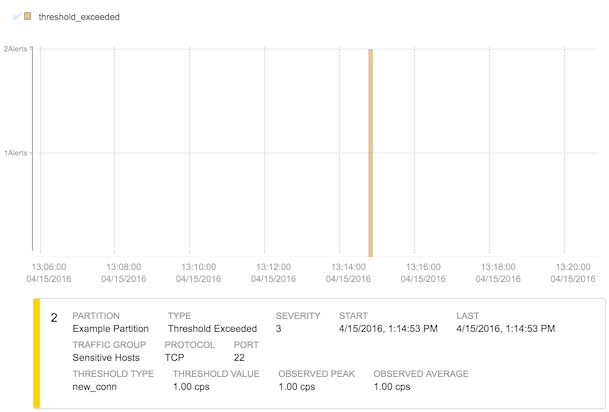
If this policy were to trigger, the notification would be seen in several places. (You can use a tool such as hping3 to simulate such an attack) First, an email would be sent to the users specified (this is performed using the email plugin, detailed separately). Second, an alert would appear on the FlowTraq Alerts page, as below.
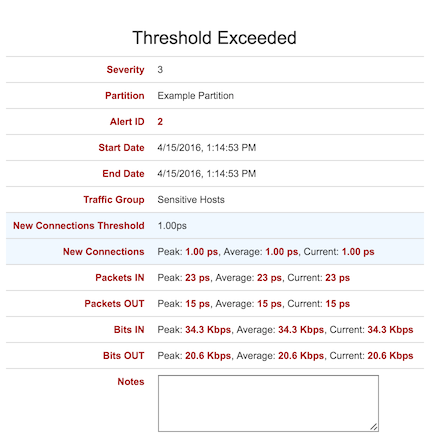
Clicking on the alert brings up additional details, as well as links for investigating the behavioral context in a workspace.
Finally, the policy page itself will show which detectors have been triggering recently by marking the boxes corresponding to the affected Traffic Groups.
At any time, you can open the policy window again to adjust parameters, change severity or action, or turn it off entirely (press the 'Clear' button at the bottom of the window).
The guide above is intended to get you started with some of the basics, but there is a great deal more to do in FlowTraq. The rest of this manual contains explanations, information, and tips for using the software. For now, it's time to start exploring your data.
Over the next few days, and as you define Traffic Groups, the Quickviews page will become more useful. Its long-term trend analysis is often a good place to start when investigating conditions that may be recurring over long periods of time, or may have changed gradually. As you continue using FlowTraq, you will be able to use that page to quickly look at traffic trends over the prior weeks, months, or even years.
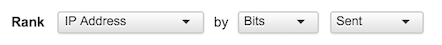
In the meantime, the Workspaces page, used for investigation into your full-fidelty flow data, is already receiving data and ready for investigation. The default view shows the top users of bandwidth in your network (both sending and receiving data). You can switch this to top talkers by adjusting the Rank line (in the upper left, below the Favorite star and the filter box) to look like the following, and then pressing the blue "Apply" button in the upper right.
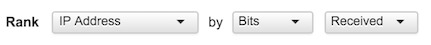
By the same token, you can switch this to top listeners by adjusting the Rank line to look like the following, and then pressing the "Apply" button. Each time you press "Apply", FlowTraq adjusts the time window so that you're always looking at the most recent (in this case) 15 minutes. The time frame can be adjusted in the upper right.
The top talkers and top listeners, as you see, include hosts both inside and outside your network. Often it is desirable to only see those hosts (or netblocks, or autonomous systems...) inside your network or vice versa. If you defined Internal Netblocks earlier, you can now use the special "INT" filter. Click in the Filter box to get the filter interface. You can change the filter element type from "Client IP" to "Receiving IP" (or any other type)
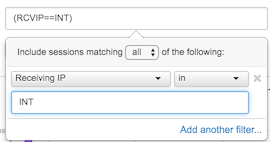
By the same token, switching both the filter and the Rank to "sending" and "sent" will show the top talkers in your network. Changing the filter from "in" to "not in" INT will focus on those IPs outside your network, etc.
The FlowTraq Workspace contains many options to filter and view your full-fidelity traffic, and we encourage you to explore the different filter elements and view combinations.
As you find filters and view combinations of interest,
