
FlowTraq can be deployed in hierarchical cluster configurations in high-traffic environments or to spread processing and storage load over a wider group of hosts. A FlowTraq cluster is made up of a single FlowTraq portal node and a group of one or more worker nodes deployed hierarchically below it. This document details the most common cluster configuration, suitable for most deployments. For other options, contact FlowTraq Support.
A portal node is a full FlowTraq install including the FlowTraq server and the FlowTraq Web interface. It receives flow data from one or more exporters, and is responsible for load-balancing that data among the rest of the cluster. The portal is the only FlowTraq node that the user directly connects to.
A worker node is a FlowTraq server install alone. It is configured to permit login only from another FlowTraq install, and receives a share of the flow data received by the portal. A FlowTraq cluster can contain any number of worker nodes, and will automatically load-balance according to the number and position of nodes within the cluster.
The size of a FlowTraq cluster is only one determinant of the overall cluster's performance in processing and retrieving flows. Hardware type and configuration, as well as current flow rates, also impact performance in the long term and short term. The values shown on the cluster administration page are best-case numbers determined by reported hardware. When deploying in a virtual environment, it is important to recognize that individual FlowTraq nodes are unable to determine when they are sharing resources. Disk I/O channels in particular, when shared, can form a bottleneck that is difficult to identify.
![[Important]](../common/images/admon/important.png) | Important |
|---|---|
Each node in a FlowTraq cluster must have its own license. |
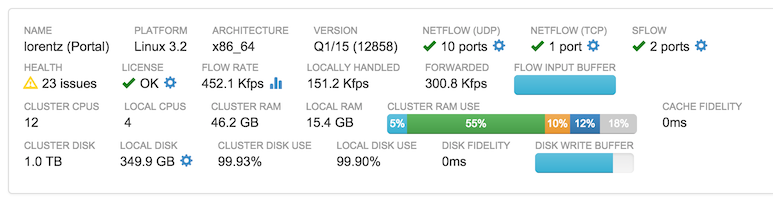
Many FlowTraq installs consist only of one (portal) node. Whether a cluster contains one node or many, the portal node information is always available at the top of the cluster administration page. An example is shown below.
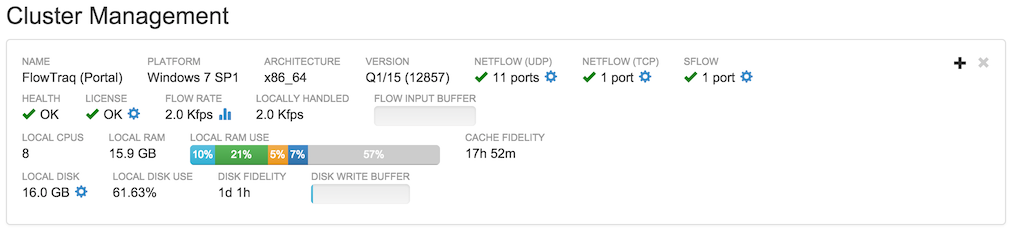
This block contains a great deal of information about the FlowTraq install's health and status. Additional information is available in many of the subsections by hovering over that section.
In addition, each blue icon (such as the cog) can be clicked to bring up a configuration menu specific to that component.
- Name
The reverse DNS-resolved name of the host on which this FlowTraq node resides
- Platform
The operating system on which this FlowTraq node resides
- Architecture
The CPU architecture type of this FlowTraq node
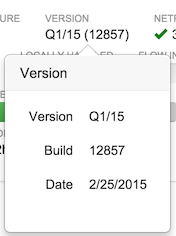
- Version
FlowTraq version and build number
- NetFlow (UDP)
The UDP ports opened for NetFlow, J-Flow, and similar protocols
![[Note]](../common/images/admon/note.png)
Note Clicking the cog icon brings up a menu in which individual UDP ports can be added or removed to the list; it is important to avoid overlap with the sFlow list
- NetFlow (TCP)
The TCP ports opened for IPFIX and similar protocols
Note Clicking the cog icon brings up a menu in which individual TCP ports can be added or removed to the list
- sFlow
The UDP ports opened for incoming sFlow samples
Note Clicking the cog icon brings up a menu in which individual UDP ports can be added or removed to the list; it is important to avoid overlap with the NetFlow (UDP) list
- Health
Current estimated health status. Hover for list of error conditions, if any.
- License
FlowTraq license status
Note Clicking the cog icon brings up a license update window
- Flow Rate
Current flow rate arriving at this node in flows per second, or thousands of flows per second
Note Clicking the graph icon brings up a window showing a line graph of recent flow rate history
- Locally Handled
Current flow rate handled by this node in flows per second, or thousands of flows per second
- Flow Input Buffer
A percentage graph showing the fullness of FlowTraq's flow input buffers. In ordinary operation, this graph should be nearly or entirely empty. If this bar begins to fill, that is an indicator that FlowTraq is having difficulty with the current flow load. If this is the result of a brief peak, then the bar will recede as FlowTraq works through the backlog. Long-term high buffer load, however, is an indicator that this FlowTraq node has insufficient resources for sustained flow load.
- Local CPUs
Number of cores on the host on which this FlowTraq node resides
- Local RAM
Total RAM on the host on which this FlowTraq node resides (not total RAM used by FlowTraq)
- Local RAM Use
Breakdown of local RAM use by FlowTraq, according to data structures and cache use. Hovering over each section shows additional details of usage
- Cache Fidelity
An indicator in terms of time of the length of the RAM-based session cache on this host; this value should be monitored to ensure that it stays long enough to keep common queries fast. Typically, 15 minutes is the absolute minimum value desired, with most installs aiming for a cache fidelity of several hours or a full day of history.
Note The connection tracker fidelity, the maximum age of sessions that can still be considered in progress, is typically much smaller than this number, and is a subset of the overall memory cache. The exact value varies by flow rate.
- Local Disk
Amount of disk this FlowTraq node is configured to use for session storage
Note The FlowTraq session database on this host can be reconfigured by clicking the gear icon. Note that changes to this value are not instantaneous. Reducing the disk use may involve a process of selecting old flows for aging out of the database. Increasing disk use requires incremental allocation of disk as new sessions are written.
- Local Disk Use
Percent of the local disk value actually used. It is normal for this value to approach 100% in ordinary operation of the software; FlowTraq selectively removes old sessions to make room for new sessions. After a reduction in database size, this value may exceed 100% in the process of selectively pruning to achieve the new, smaller, size.
- Disk Fidelity
The estimated maximum age for which this FlowTraq node has complete forensic recall. Older sessions may appear in the FlowTraq workspace, but concurrent sessions may have been aged out of the workspace, presenting an incomplete view.
- Disk Write Buffer
An indicator of the fullness of FlowTraq's storage buffer; that list of sessions that must be written to disk. In normal operation, this buffer should be empty or nearly empty. An increase in buffer fullness indicates a disk I/O bottleneck. If this buffer becomes full, flows may be lost before they can be written to long-term storage.
In addition to these items, the portal node of a cluster containing more than one FlowTraq server will have the following entries.
- Cluster CPUs
The total number of cores in all of the systems comprising the FlowTraq cluster
- Cluster RAM
The total amount of RAM in all of the systems comprising the FlowTraq cluster
- Cluster Disk
Total disk space configured by all of the nodes together in the FlowTraq cluster; this disk space may or may not be allocated already
- Cluster Disk Use
Total disk space used, as a percentage of the total cluster disk space configured. The actual percentage on any given FlowTraq host may vary considerably according to how recently that host was added to the cluster, but over time should become roughly uniform
A node that has been configured as a worker can be added at any part of a cluster, at any level, by selecting the "+" icon in the upper right hand corner of the desired parent node's status block. The parent node is frequently the portal, but not always. A dialog box will be shown asking the details of the configuration of this worker, including its IP address and the ports configured for communication and flow forwarding.
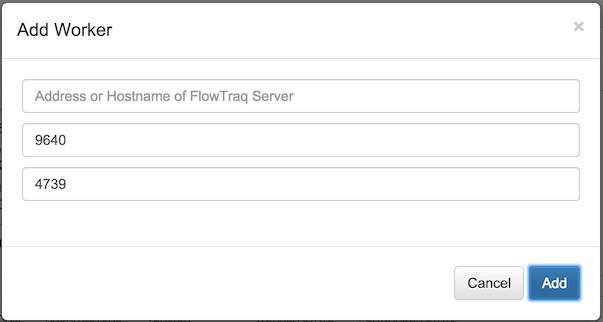
Upon confirming these values, the parent node selected
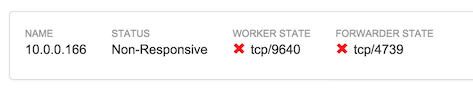
A worker node has the following additional entries in its status block.
- Worker Status
The status of this node in terms of its ability to receive and process commands from the portal, and the TCP port on which it is connected to the cluster
- Forwarder Status
The status of this node in terms of its ability to receive a share of flow data, and the TCP port on which it is receiving that share
The selection of the parent node determines the shape of the cluster and the behavior of the load-balancing. Each node receives an equal share of incoming flows from its parent according to the number of fellow workers at its level (with the parent consuming one share as well). A three-node cluster may be structured in one of two ways, as shown below.
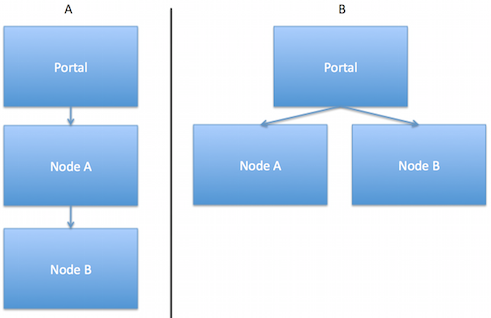
Cluster A is constructed by adding Node A to the portal, and then adding Node B to Node A. In this configuration, the portal has one worker, and therefore keeps a 50% share of the incoming flows and sends the remaining 50% to Node A. Node A splits its incoming flows similarly. As a result, the portal handles 50% of the total incoming flows, and Nodes A and B each handle 25%.
Cluster B is constructed by adding Node A to the portal, and then adding Node B to the portal. In this configuration, the portal has two workers. It therefore keeps one-third of the incoming flows, and sends a third to each of Node A and B, resulting in each node handling 33% of the total incoming flows.
| Important |
|---|---|
It is critical when adding workers to avoid circular paths -- the case where a node is its own worker (at any remove). This can cause FlowTraq to become unresponsive. It is recommended to draw a cluster diagram, including IP addresses, and checking for duplicate entries before adding workers. |
Any node except the portal can be removed by clicking the 'X' icon in the upper right hand corner of its status box. Doing so reconfigures its parent node to remove all references to that worker, with the result that the worker will no longer receive a share of flows, and will no longer receive requests for flow information. The former worker's settings are not changed, nor is its flow cache transferred or deleted. Its share of historical flows will no longer be available in historical queries unless it is added again as a worker to that node or another.
A removed worker remains in worker mode, and may be reattached to the cluster at any time and at any position in the cluster. A worker that is to be moved to another part of the cluster should be removed first before adding it at the second position.
FlowTraq supports automated syslog messages for monitoring a FlowTraq cluster. Information sent includes user authentication and failure messages, exporter status health, workers not responding, and other statuses. All messages are sent with a FlowTraq-specific identifier in the structured data field: the SD-ID ft_TYPE@41180 (where TYPE may be login, exp, etc.).
A syslog receiver is configured in the flowtraq.conf FlowTraq server daemon configuration file on the FlowTraq portal. After adding or removing a configuration, the FlowTraq daemon process must be restarted or sent a HUP signal to trigger a reconfiguration. Below is an example of a syslog configuration:
			<syslog>
			   facility    LOCAL0
			   loghost   192.168.2.100
			</syslog>
The configuration has two standard parameters, detailing the host to send syslog messages to, and the syslog facility level to tag those messages with.
Investigating trouble conditions in a FlowTraq cluster begins on the cluster page, and there are several conditions that can be identified by the information found there.
If a FlowTraq node does not respond to the portal's information request, for whatever reason, it will be marked as unresponsive and most of the information ordinarily shown in the status box will not be present.
FlowTraq will not automatically remove non-responsive nodes, but will no longer send a share of flows to that node. It will continue to attempt to contact that node in response to queries and information requests until either the node begins responding, or the user manually removes the node via the 'X' icon in the upper right corner of the status box.
Troubleshooting a non-responsive node generally begins by verifying the IP address and ports shown. A frequent cause of non-responsiveness is that the host is no longer available: it has shut down, is rebooting, or now has a different IP address. If a node has never responded, firewall rules should be examined as well as the node configuration (to ensure it is in worker mode).
FlowTraq clusters with the suggested hardware provisioning are generally capable of handling steady state flow rates of approximately 25,000 flow updates per second, and can withstand peak flow rates several times that for brief periods. Excessive load can result due to either sustained periods of heavy flow rate, or as a result of one or more workers being unavailable for long periods of time. There are several potential indicators of excessive flow load.
The primary two indicators of a node's ability to keep up with flow load are the Flow Input Buffer and the Disk Write buffer. The former is an indicator of the node's ability to process incoming flow, and the latter an indicator of the node's ability to store flow records to disk. A partially full buffer in either case indicates that the node is falling behind. A completely full buffer is an indication that flows are being lost, either before they can be processed or before they can be stored to disk.
FlowTraq monitors these and other parameters, and summarizes any problems it finds in the Health field. Hovering over this field gives an overview of any issues with the selected node, and issues with its workers (if any).
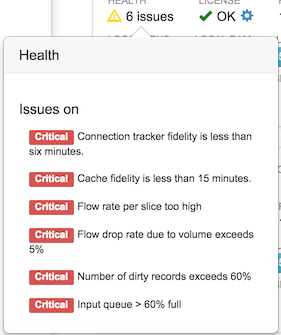
The steps to resolving an excessive load condition vary according to the cause. Excessive load due to missing nodes should be addressed by investigating those nodes. Excessive load over the long term is usually a sign that the cluster is underprovisioned for the flow load: additional nodes should be added to the cluster, or additional hardware resources deployed.
