
This section details the three most common methods of configuring Cisco routers to export NetFlow, depending on IOS version. These are:
-
Flexible NetFlow Flexible NetFlow is available on recent Cisco devices running an IOS version in the 15 Family, IOS 12.4T, or IOS 12.2. It is the most complicated option available, but offers unparalleled customization options.
-
Traditional NetFlow, for newer IOS versions Cisco IOS Releases 12.2(14)S, 12.0(22)S, 12.2(15)T, or later. (Catalyst 6500 Series devices should use Flexible NetFlow)
-
Traditional NetFlow Cisco IOS Releases prior to the 12 Family, up to 12.2(14)S, 12.0(22)S, 12.2(15)T.
There are three basic objects that need to be understood in order to make sense of Flexible NetFlow:
Records
Exporters
Monitors
The terms aren't necessarily obvious in their meaning. One can think of a Cisco device as an inspection station, with packets going by from one interface to another. Inspectors examine the packets and produce reports to send outside. There may be multiple inspectors, each of whom might send a couple different reports to a couple different places depending on the kind of packets they see. In order for them to perform their tasks, a few things need to be defined:
The forms they fill out and send as the reports. The forms will have required fields and optional fields; if a given packet doesn't have the information needed to fill out a required field, that form doesn't get filled out. The form fields have standardized names so that the end reader of the form knows exactly how to treat the contents.
An envelope format with standardized address labels to match to completed forms and send on their way, detailing everything needed to deliver a form to a specific destination, as well as any special instructions.
A set of standing orders: Watch this set of packets (an interface). Fill out these forms. Send them in these envelopes.
Such a form is called a Record, and constitutes a NetFlow 9 or IPFIX template. The envelope is an Exporter, and gives the details of the host receiving NetFlow records. The set of standing orders describes a Monitor, a process on your router that collects and sends NetFlow records and templates.
Below follows the process of assembling records, exporters, and monitors, and show the commands needed to enter them into your Cisco device running an IOS version in the 15 Family, IOS 12.4T, or IOS 12.2. As with previous NetFlow export configurations for Cisco devices, one of the following must be enabled on your router and on any monitored interfaces: Cisco Express Forwarding (CEF), distributed Express Forwarding (dCEF) or their IPv6 equivalents.
A Record is a description of a NetFlow 9 template. This template will be sent periodically to FlowTraq so that it knows how to interpret the NetFlow datagrams that describe network sessions. There are two primary commands: match and collect. Match denotes a key, or mandatory, field; if there is not sufficient data in the session to fill it out, then that session is not recorded using that record. A common match field is IPv4 address; an IPv6 packet does not contain an IPv4 address, therefore the match fails and no record is generated. Collect denotes an optional, non-key, field such as VLAN. A space will be reserved for collect fields, but they will simply be left as '0' if not present.
Cisco provides a number of pre-defined records, however we outline the steps taken to define a custom record. Each of the command sets below is performed in global configuration mode.
			! First create a name to define the flow record
			flow record ipv4_record
			! Having entered that, we're in flow monitor configuration mode
			! Start with the match commands, which really define what we're getting
			match ipv4 source address
			match ipv4 destination address
			match ipv4 protocol
			match transport source-port
			match transport destination-port
			! Now the rest of the flow record
			collect interface input
			collect interface output
			collect counter packets
			collect counter bytes
			collect timestamp sys-uptime first
			collect timestamp sys-uptime last
			collect transport tcp source-port
			collect transport tcp destination-port
			collect ipv4 tos
			collect transport tcp flags
			collect routing source as
			collect routing destination as
			collect ipv4 source mask
			collect ipv4 destination mask
			collect flow direction
			! exit flow monitor configuration mode
			exit
Many of these items are specific to IPv4. This is due to the length specifications in the NetFlow datagram: a Record is specifying which data goes in which field, how long the field is and how to interpret it. IPv6 and IPv4 addresses, being such different lengths, must be dealt with differently, which requires separate forms. Internally, this data is broken down according to a logical tree structure -- once a packet is identified as being IPv6, then all of the IPv4 fields will be blank. The configuration must therefore switch everything (protocol, masks, etc) to read out of the v6 tree.
			! Create an IPv6-specific name
			flow record ipv6_record
			! Note that several fields not directly related to IP version change
			match ipv6 source address
			match ipv6 destination address
			match ipv6 protocol
			match flow direction
			match transport source-port
			match transport destination-port
			collect interface input
			collect interface output
			collect counter packets
			collect counter bytes
			collect timestamp sys-uptime first
			collect timestamp sys-uptime last
			collect transport tcp source-port
			collect transport tcp destination-port
			collect ipv6 tos
			collect transport tcp flags
			collect routing source as
			collect routing destination as
			collect ipv6 source mask
			collect ipv6 destination mask
			! exit flow monitor configuration mode
			exit
You may wish to skip this step, and use one of the pre-defined templates (see the Monitor section below on how to do this), however, you are still required to define an Exporter.
The Exporter is a description of a destination for flow records, which is the collector. At this stage we are not specifying what is being sent, instead we are just crafting the envelope. This also determines how often to send templates -- 5 minutes in the configuration below, which will reduce bandwidth overhead slightly, but will result in a delay of 5 minutes after any reconfiguration. Official recommendations range from templates resends once a minute to resending twice an hour.
			! create a name for the exporter configuration and enter exporter configuration mode
			flow exporter my_flow_collector
			destination [IP address of your flow collector]
			! The 'source' is the "return address" and will determine the IP address used to identify this device to the collector
			source [name of an interface]
			! Define the port number and protocol; most flow collectors use the default NetFlow port, 2055/UDP
			transport udp 2055
			export-protocol netflow-v9
			! Send a template every 5 minutes
			template data timeout 300
			! exit flow exporter configuration mode
			exit
The final stage is setting up the Monitor itself. Having already done the heavy definition work, this bit goes fast, in two parts. First, define the monitor:
			! Give it a name that you'll recognize later in the interface configurations
			flow monitor main_monitor
			! Tell it what forms to fill out; we're using a named Record, so the command is simple:
			record ipv4_record
			! Tell it what collector to send them to
			exporter my_flow_collector
			! You can add more here if you need to
			exporter my_second_flow_collector
			! Tell it how often to time out its cache -- a lower number of seconds
			! will send more flow updates (potentially a strain on collector processing power for some collectors)
			! while a longer timeout risks loss of sessions through cache overflow
			cache timeout active 30
			exit
Remember that different Records for IPv4 and IPv6 traffic were created; each needs a separate Monitor:
			flow monitor main_monitor_v6
			record ipv6_record
			exporter my_flow_collector
			cache timeout active 30
			exit
To use a pre-defined Flexible NetFlow "NetFlow IPv4/IPv6 original input" template instead, substitute an alternate record command:
record netflow ipv4 original-input
or
record netflow ipv6 original-input
Finally, deploy the monitor by selecting the desired interface(s) and attaching it:
			interface InternalNetwork/0
			ip flow monitor main_monitor input
			exit

			interface InternalNetwork/1
			ip flow monitor main_monitor input
			exit

			...
For networks carrying both IPv4 and IPv6 traffic, it may be necessary to apply a monitor to an IPv6 interface as well:
			interface InternalNetwork/1
			ip flow monitor main_monitor input
			ipv6 flow monitor main_monitor_v6 input
			exit
In most situations, you will be applying a monitor to each interface. In such a case, that "input" line will be sufficient -- all bases are covered by monitoring each interface's Ingress traffic. If you choose not to monitor all interfaces, you may need to add an output monitor as well so that both Ingress and Egress traffic are covered:
			interface InternalNetwork/1
			ip flow monitor main_monitor input
			ip flow monitor main_monitor output
			exit
At this point the Cisco device is configured and exporting NetFlow. Depending on the configured timeouts, it could take some minutes for session traffic to start arriving and being processed. If traffic fails to arrive at your collector, there are a few things check:
First, make sure that your NetFlow collector is listening on the correct port (UDP 2055 above) and that any firewalls in between (particularly on the host running the collector) allow the NetFlow packets to pass.
Second, double-check the Exporter configuration and ensure the collector IP address listed is correct and routable. You can verify the flow of session records using a packet capture utility such as Wireshark or TCPdump.
Third, make sure the configuration includes all the data needed to store full network session records: typically, collectors require IP addresses, protocol, port numbers, and byte and packet counts.
Finally, if none of the above troubleshooting methods worked, contact your vendor's support.
For simple pre-defined NetFlow output, most Cisco devices offer a fast and straight-forward monitoring solution. The specific commands required depend on your version of IOS, however: This document is for Cisco IOS Releases 12.2(14)S, 12.0(22)S, 12.2(15)T, or later. The primary change from the older method of configuring NetFlow export is the switch to the "ip flow" command, which is used by both this method and Flexible NetFlow.
![[Important]](../common/images/admon/important.png) | Important |
|---|---|
Note: Interfaces to be configured for NetFlow export using this method may need to be first configured for one of:
|
In global configuration mode (in EXEC mode, type "configure terminal"), go through the list of interfaces enabling flow export. The exact interface selection command varies by device and whether you are configuring an interface or sub-interface. Enter configuration mode for each interface and add the line, "ip flow ingress" and then exit back to global configuration mode:
	 # interface FastEthernet0/0
	 # ip flow ingress
	 # exit
	 # interface FastEthernet0/1
	 # ip flow ingress
	 # exit
It is important to configure all of the interfaces because only Ingress traffic will be reported with this configuration -- if you skip an interface, then all traffic entering that way gets discarded, regardless of which interface it exits. If you are uninterested in traffic entering or exiting a specific interface, it is better to filter it out when viewing and analyzing the traffic.
Once all of the interfaces are configured to collect NetFlow statistics, configure the NetFlow export destination:
	 # ip flow-export destination [IP address of your NetFlow collector]  [2055]
	 # ip flow-export source FastEthernet0/0
	 # ip flow-export version 9
You may use "version 5" for NetFlow v5, but this is not recommended. NetFlow v5 is not IPv6 compatible.
At this point NetFlow export has been configured. Exit global config mode and execute the 'write' command to save the configuration. The following additional commands are recommended. Your Cisco device exports flows according to an internal schedule depending on whether they are considered active (packets are still flowing for that connection) or inactive (some number of seconds have passed since the last packets; when a flow is marked 'inactive' it is reported and then removed from the list).
# ip flow-cache timeout active 1
This command command configures the exporting of active connections once per minute. This adds to the CPU load on your Cisco device, but ensures the timely reporting of updates for your flow analysis tools.
# ip flow-cache timeout inactive 15
This command sets the definition of 'inactive' to "no new packets for 15 seconds". A lower value here reduces the load on your Cisco device CPU, but increases NetFlow export traffic on your network. A value of 15 is a good compromise between those considerations, ensuring that very short sessions are quickly taken care of.
There is an additional command, "ip flow-cache entries [number]" in order to directly change the size of the flow cache from the default to up to 524,288 entries. Cisco discourages use of this command as changes in RAM footprint can impact vital router tasks, but under certain circumstances it may be better to make a modest increase to this value in environments with very heavy flow traffic in order to ensure full fidelity. The command "no ip flow-cache entries" will reset this value to the device-dependent default setting (65,536 on Cisco 7500 routers).
In order to verify and inspect the collected flow stats, the following command may be executed in EXEC mode:
# show ip cache flow
| Important |
|---|---|
Important note: any changes made to these settings after initially configuring NetFlow export, will not take effect until you either reboot your device or disable flow export on all interfaces. |
![[Tip]](../common/images/admon/tip.png) | Tip |
|---|---|
Notes from Cisco: If your router is running a version earlier than Cisco IOS Release 12.4(20)T, and your router does not have a VPN Service Adapter (VSA)-enabled interface, enabling the ip flow ingress command will result in the ingress traffic being accounted for twice by the router. If your router is running a version earlier than Cisco IOS Release 12.4(20)T, and your router has a VSA-enabled interface, enabling the ip flow ingress command will result in the encrypted ingress traffic being accounted for only once. If your router is running a version of Cisco IOS Release12.4(20)T or later, enabling the ip flow ingress command will result in the encrypted ingress traffic being accounted for only once. |
For simple pre-defined NetFlow output, most Cisco devices offer a fast and straight-forward monitoring solution. The specific commands required depend on your version of IOS, however: This section is for Cisco IOS Releases prior to 12.2(14)S, 12.0(22)S, or 12.2(15)T, in their respective family branches.
| Important |
|---|---|
Note: Interfaces to be configured for NetFlow export using this method may need to be first configured for one of:
|
Enter global configuration mode (in EXEC mode, type "configure terminal"), and enable flow export on all the interfaces. The exact interface selection command varies by device, depending on whether you are selecting "slot/port" (e.g. for Cisco 7200 series routers) or "slot/port-adapter/port" (e.g. for Cisco 7500 series routers). Enter configuration mode for each interface and add the line, "ip route-cache flow" and then exit back to global configuration mode:
		# interface FastEthernet0/0
		# ip route-cache flow
		# exit
		# interface FastEthernet0/1
		# ip route-cache flow
		# exit
| Important |
|---|---|
If the |
It is important to configure all of the interfaces because only Ingress traffic will be reported with this configuration -- if you skip an interface, then all traffic entering that way gets discarded, regardless of which interface it exits. If you are uninterested in traffic entering or exiting a specific interface, it is better to filter it out when viewing and analyzing the traffic.
Once all of the interfaces are configured to collect NetFlow statistics, configure the NetFlow export destination:
		# ip flow-export destination [IP address of your NetFlow collector]  [2055]
		# ip flow-export source FastEthernet0/0
		# ip flow-export version 9
You may use "version 5" for NetFlow v5, but this is not recommended. NetFlow v5 is not IPv6 compatible.
At this point NetFlow export has been configured. Exit global config mode and execute the 'write' command to save the configuration. The following additional commands are recommended. Your Cisco device exports flows according to an internal schedule depending on whether network connections are considered active (packets are still flowing for that connection) or inactive (some number of seconds have passed since the last packets; when a flow is marked 'inactive' it is reported and then removed from the list).
# ip flow-cache timeout active 1
This command command configures the exporting of active connections once per minute. This adds to the CPU load on your Cisco device, but ensures the timely reporting of updates for your flow analysis tools.
# ip flow-cache timeout inactive 15
This command sets the definition of 'inactive' to "no new packets for 15 seconds". A lower value here reduces the load on your Cisco device CPU, but increases NetFlow export traffic on your network. A value of 15 is a good compromise between those considerations, ensuring that very short sessions are quickly taken care of.
There is an additional command, ip flow-cache entries [number] in order to directly change the size of the flow cache from the default to up to 524,288 entries. Cisco discourages use of this command as changes in RAM footprint can impact vital router tasks, but under certain circumstances it may be better to make a modest increase to this value in environments with very heavy flow traffic in order to ensure full fidelity reporting at minimal CPU load. The command "no ip flow-cache entries" will reset this value to the device-dependent default setting (65,536 on Cisco 7500 routers).
In order to verify and inspect the collected flow stats, the following command may be executed in EXEC mode:
# show ip cache flow
| Important |
|---|---|
Any changes made to these settings after initially configuring NetFlow export, will not take effect until you either reboot your device or disable flow export on all interfaces. |
VMWare’s vSphere and related technologies allow users to create a single virtual datacenter spanning multiple ESXi hosts, and provide a convenient user interface for creating and managing those virtual switches, including NetFlow monitoring. vSphere 5.1 exports NetFlow v5; later versions export IPFIX. In order to make use of NetFlow functionality with an ESXi hypervisor, it is necessary to use the vSphere Web Client, which is distributed with vCenter Server.
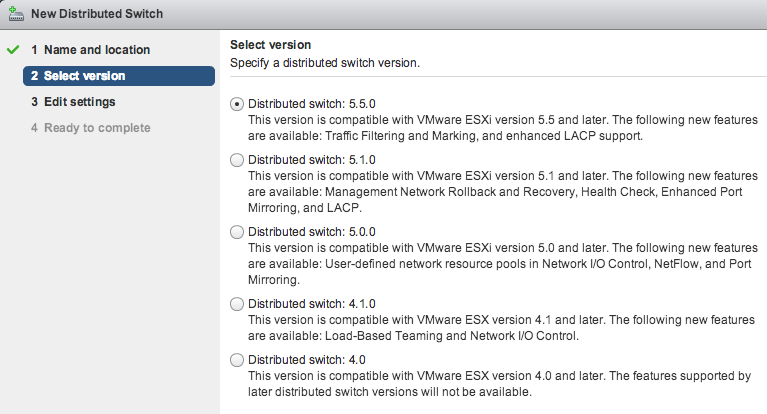
Log into your vSphere Web Client with privileges sufficient to administer virtual network devices. Select your virtual distributed switch under the Network Inventory tab, and make sure it is configured as compatible with ESXi 5.1 or later.
| Important |
|---|---|
Existing switches configured as version 5.0.0 or earlier must first be migrated to one of these compatible versions before NetFlow export can be configured. |
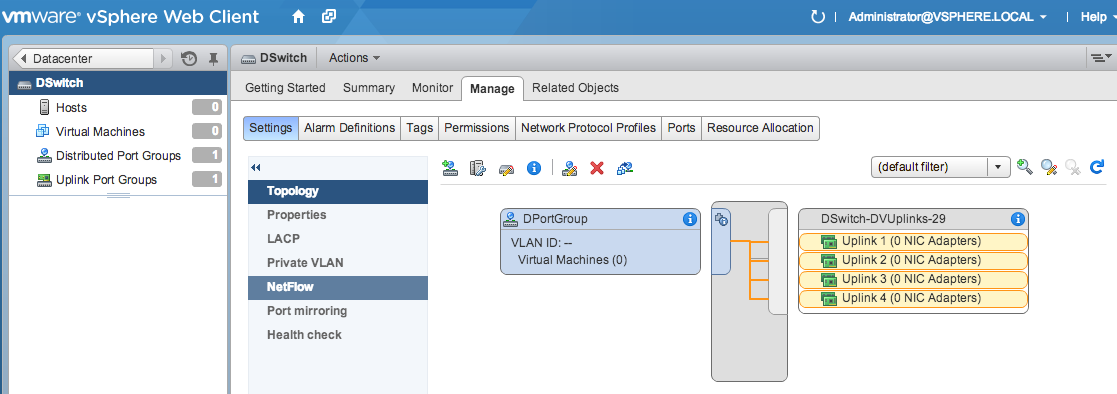
Once your virtual distributed switch is configured, select it in your inventory and navigate to “Manage” and then the "Settings" tab. There will be a Netflow option in the menu on the left.
Select that tab, and fill in the details of your FlowTraq server: IP address and UDP Port.
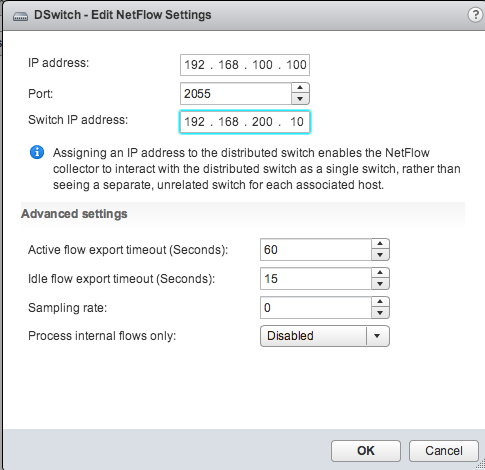
There is a third required field, labeled Switch IP Address or VDS IP Address. This is the reported exporter address for this NetFlow stream, and is used to identify the virtual switch. You will need to remember which address corresponds to which virtual switch.
Below these fields are further configuration options:
Active flow timeout is the rate in seconds at which your virtual switch will report on sessions that are ongoing (e.g. it sends an update every 60 seconds)
Idle flow timeout is the time in seconds after the last packet detected for a flow, at which point the switch will close out the session and send a final update.
Sampling Rate is the divisor used to determine what portion of the traffic to monitor. A rate of 2 inspects every other packet; a rate of 10 inspects every 10th packet.
Process Internal Flows Only instructs the virtual switch to only monitor communications internal to the host, and may be useful if that is the only visibility you require from this exporter (such as when you are already monitoring external communications from elsewhere).
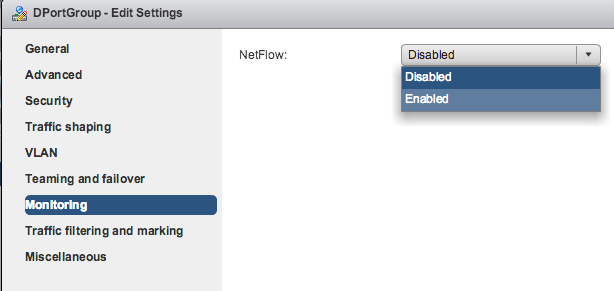
Once that configuration is complete, NetFlow must be enabled. Click OK. Then, in the device inventory, select the associated Distributed Port Group (the distributed ports are analogous to interfaces). Select each group and then select “Settings”. Navigate to “Monitoring”, and there will be an option for “NetFlow Status”. Enable this, and click OK. Do this for each Distributed Port Group.
NetFlow exporting should begin after the period of time specified in "Active Flow Timeout". If NetFlow packets do not arrive after that time, make sure that the requisite ports are open in FlowTraq, that the selected collector is routable from the ESXi host, and that all intervening firewalls allow the traffic.
Open vSwitch is a popular open source SDN solution that can be run on any Linux-based virtualization platform, and supports a wide variety of systems such as KVM, VirtualBox, ProxMox VE, Xen Cloud Platform, XenServer, and others. Despite the intricacy of these networks, it is very easy to configure NetFlow export from any number of virtual switches.
Configuration of an Open vSwitch system is accomplished via its vswitchd database. The ovs-vsctl command-line tool provides an interface to the vswitchd configuration database via the ovsdb-server process, and can be used to configure NetFlow, IPFIX, and sFlow. Monitoring is accomplished by attaching NetFlow configurations to individual defined bridges; you’ll need to configure each bridge with a configuration in order to monitor all of the traffic flowing through your vSwitch.
There are two steps involved in attaching a NetFlow monitor to a bridge: defining the monitor, and linking a bridge to it. Because vSwitch is aggressive about cleaning unlinked database records, the definition of the NetFlow configuration should be done at the same time as its first attachment.
Breaking this down into two steps for the sake of explanation, we must make a change to the Bridge table for the specific bridge being affected:
−− set Bridge [bridge] netflow=@[netflow conf ID]
The second step is to create a named entry in the NetFlow table (page 46 in the database schema). There are several columns described there, but at the very least there must be at least one collector (IP address and UDP port)
−− id=@[netflow conf ID] create NetFlow targets=\"[collector IP address]:[port]\"
Also useful is the add_id_to_interface (boolean) column. If it is set to false (default), then it sets the ingress and egress interface numbers to the OpenFlow ports. If it is true, then the 7 most significant bits in each field will be assigned to the engine_id column for this record (a number between 0-255).
The primary reason for the add_id_to_interface field is that you will probably have multiple monitored bridges, each with its own NetFlow exporter, but all of which are reporting the same IP address. Setting this field to true allows for easier disambiguation, at the cost of having large numbers identifying your interfaces.
Another field of interest is active_timeout (integer, time in seconds). When this is not set to -1 (disabled), your device will send updates for NetFlow records that are still active. The default timeout is 600 seconds.
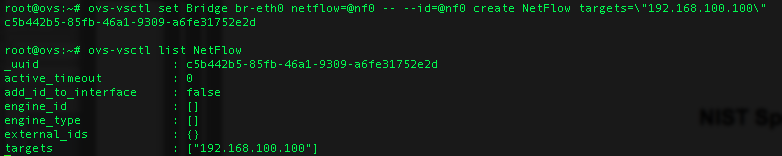
Configure bridge br0 to send NetFlow records to UDP port 2055 on host 192.168.100.100, keeping the OpenFlow port numbers as iface numbers (the -- separates commands, and is needed for the id designation):
ovs−vsctl set Bridge br0 netflow=@nf0 -- −−id=@nf0 create NetFlow targets=\"192.168.100.100:2055\" add_id_to_interface=false
If the commands must be broken over multiple lines, add a \ at the end of the lines, like so:
		ovs−vsctl set Bridge br0 netflow=@nf0 \
		-- −−id=@nf0 create NetFlow targets=\"192.168.100.100:2055\" \
		add_id_to_interface=false
Once the configuration is created, you can change any of the fields directly via the set command, referenced by the bridge to which it is attached. For example to force it to send updates on ongoing sessions at least once a minute:
ovs−vsctl set NetFlow br0 active_timeout=60
The single NetFlow configuration, once defined, can be used by other bridges, referenced by the uuid of the netflow field:
		ovs-vsctl set Bridge br1 netflow=[_uuid]

		ovs-vsctl set Bridge br2 netflow=[_uuid]
To see a list of the current NetFlow configurations (such as after making changes to our bridge configurations, or to look up a uuid), type:
ovs-vsctl list NetFlow
Finally, you can remove the NetFlow monitor from a virtual switch just by clearing the netflow field in the corresponding Bridge table entry (there is no need to delete the NetFlow table entry)
ovs-vsctl clear Bridge br0 netflow
For further reading on Open vSwitch configuration, see Scott Lowe’s article on the subject.
In addition to using export-capable hardware devices, FlowTraq offers a free software Flow Exporter to export NetFlow v5 or NetFlow v9 to FlowTraq Server. There are a number of reasons to consider using Flow Exporter:
A NetFlow-, sFlow-, jFlow-, or cFlow-capable device is not available, or cannot be configured with the necessary export fields.
To avoid putting additional CPU and memory load on existing switching or routing infrastructure.
To monitor traffic at specific hosts or servers, particularly in cloud deployments.
To convert existing packet capture files (PCAP) into flows for analysis though FlowTraq.
The Flow Exporter, regardless of platform, operates by monitoring a network interface in promiscuous mode (viewing all traffic, not just traffic intended for the host on which it resides), creating NetFlow sessions describing the observed traffic, and sending those sessions out again.
The hardware requirements of the Flow Exporter are slight. Recommended minimum hardware depends on the volume of network traffic being monitored, but for most networks, the following will be sufficient:
1 GHz processor (32-bit or 64-bit)
1 GB available RAM
100 MB available disk space
At least one network interface card (see: deployment options, below)
There are three primary deployment types used by a software NetFlow exporter:
Network tap-style monitoring -- The exporter is deployed on a host with a single network interface card (NIC), which it both monitors and uses to export NetFlow datagrams. Such a host may be a virtual machine or even a spare laptop.
SPAN port monitoring -- The exporter is deployed on a host with two NICs, with one NIC connected to a Switched Port ANalyzer (SPAN) or mirror port on a switch or router, and one NIC connected to a regularly-routed network. The Flow Exporter listens to the traffic on the first NIC, and exports NetFlow on the second. This is (almost) always a physical host.
PCAP parsing mode -- Not an ongoing deployment, but used on-demand to parse packet capture (pcap) files into NetFlow for export to flow analysis. (UNIX and Mac OS X only)
![[Note]](../common/images/admon/note.png) | Note |
|---|---|
While it is possible to operate a Flow Exporter on a virtual machine, hypervisors frequently either will not permit virtual machines to put their interfaces into promiscuous mode by default, or will suspend machines that attempt it until an administrator approves the attempt. Hypervisor documentation should be consulted carefully. |
There are multiple builds of the Flow Exporter for a variety of UNIX-type environments: select the one that best matches your architecture from the download page provided. The file retrieved is the binary itself. Place it in a new directory (such as /opt/flowexporter/) where it can write its log files.
The Flow Exporter must run with root permissions in order to open an interface for monitoring. Once the final configuration parameters are determined, it is recommended to create a shell script, and set that script to be run on boot, such as by inclusion in /etc/rc.d/rc.local or equivalent.
Flow Exporter for Windows requires WinPcap 4.1.1 (a packet capture utility for Windows) or later to be installed. The Flow Exporter download page links to the current correct version. Install WinPcap first, and then install Flow Exporter for Windows using the InstallShield executable. The installing user must have Adminstrator permissions.
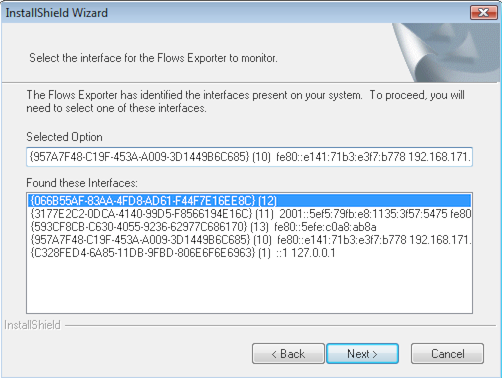
After accepting the EULA and selecting an install location, Flow Exporter will query Windows for the GUIDs of all network interface devices. It will select the most likely candidate for active interface (based in part on which interfaces have been assigned IP addresses) and then list all found devices in the window below. Verify that it has selected the correct interface, or choose another, and select next.
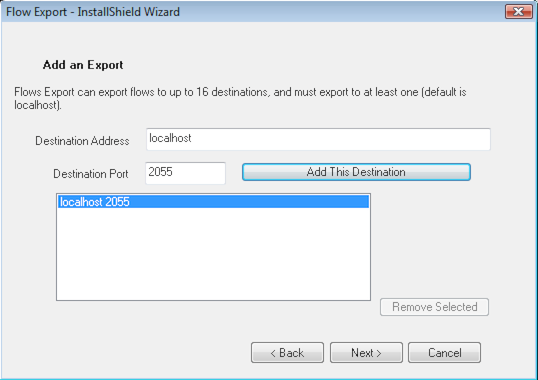
The next step is to configure Flow Exporter to export to one or more collectors. Although the installer window comes pre-populated with "localhost", the "Add this Destination" button must still be pressed to save that as a destination. At least 1, and up to 5, destinations should be added before proceeding. Exporting to these addresses will begin immediately upon successful installation.
Flow Exporter for Windows runs as a service. The easiest way to restart and stop it is to type "services" or "services.msc" into the Run field in the Start Menu, depending on Windows version. The Services menu will contain an item for Flow Exporter.
All Flow Export installs are based on the command line tool flowexport (name varies by platform), which has the following parameters.
Table 4.3. Flow Exporter Parameters
| Parameter | Description |
|---|---|
-i IFACE
| Select capture interface IFACE for monitoring; this is generally in the form ethX on UNIX-type systems, and will be a GUID on Windows systems. If the -i parameter is omitted, Flow Exporter autoconfigures with the best match. |
-nf5 COLLECTOR [UDP port]
| export NetFlow v5 datagrams to COLLECTOR host [optional UDP port] (flowexport only) |
-nf9 COLLECTOR [UDP port]
| export NetFlow v9 datagrams to COLLECTOR host [optional UDP port] (flowexport only) |
-n COLLECTOR [UDP port]
| export IPFIX datagrams to COLLECTOR host [optional UDP port] (ipfixexport only) |
-t COUNT
| Create COUNT number of entries in the connection tracker table in RAM. Default value is 256K simultaneous connections tracked. |
-T THREADS
| Spawn THREADS number of connection tracking threads, each with its own connection tracker of the size specified by COUNT. (As a result, COUNT x THREADS sessions total will be tracked) |
-s
| Scan available interfaces and addresses on the host; display them. (Does not start flow export) |
-d
| Do not daemonize process. Required for Windows command-line use; recommended for use with Mac OS X launchctl |
-c FILE.conf
| Use the specified configuration file |
-I FILE.conf
| Use the specified interface file to map CIDR blocks to interface numbers. Can be used to replicate router functionality or as a functional index into data for fast search. File format is "CIDR ifindex", one per line. Unassigned addresses assigned ifindex 1. |
-f FILE.pcap
| Read packet capture file instead of monitoring live traffic. NOTE: Mac OS X and UNIX hosts only. |
-p
| Do not put monitored interface in promiscuous mode (only report on traffic involving this host) |
-a
| Minimum age in seconds before updating an inactive flow. (Default: 30 seconds) |
-e
| Minimum age in seconds before updating any flow (active or inactive). (Default: 120 seconds) |
-FTHP
| Enable FlowTraq High Precision Timestamp extensions for millisecond precision (NetFlow v9 export only) |
-guid XXX-XX...
| Specify GUID for the FlowTraq partition to which this traffic should be automatically assigned. Overrides internal assignment. (NetFlow v9 export only; FlowTraq Q2/14 or later) |
-h
| Command-line help |
