
Plugins are external scripts or computer programs that FlowTraq can trigger in response to an alert on Linux-based installations. Plugins are used for a variety of actions, from generating email or syslog notifications, to signaling DDoS mitigation actions, to invoking in-house software. During the course of an alert, the same plugin may be triggered many times with updated information about the state of an alert condition or the progression of the behavior being monitored. Configuration and alert details are passed to your plugin through environment variables.
To invoke a plugin in response to an alert, a plugin configuration must be associated with the policy rule that triggered the alert. By design, plugins are bound to their partitions, and only partition managers may interact with them or assign them to policy rules. This process is described in the Administration portion of this manual.
![[Important]](../common/images/admon/important.png) | Important |
|---|---|
As external scripts triggered by the FlowTraq server process, plugins from untrusted sources can have serious security implications, and so should be reviewed carefully. If in any doubt, FlowTraq Support is available to answer any questions on the subject. |
In addition to the plugin script itself, each FlowTraq plugin must have specific files that describe how FlowTraq should communicate with your plugin, including how to describe it, how to configure it, and how to interpret its annotations. Also, FlowTraq has made available a template plugin to use as the basis of either a Python or shell script
In the sections below, the FlowTraq plugin invocation process process is described in greater detail, including command line arguments and specific environment variables.
Alerts trigger their associated plugins according the following rules:
CREATE: upon alert creation the plugin is triggered with the first argument "CREATE".
UPDATE: as long as the alert condition persists FlowTraq may call the plugin again with the first argument of "UPDATE" to indicate the condition is still active, and more information has come in. This happens at most once per minute. The plugin author should not assume a strict 60 second timing between UPDATEs, but the schedule will not under ordinary operating conditions vary from that by more than a few seconds.
DELETE: if the alert condition has not been seen for at least 10 minutes since the last "CREATE" or "UPDATE", the plugin will be invoked with the first argument of "DELETE", indicating that the alert is no longer active.
Additionally, there is an optional TEST status. This is not called during ordinary alert functionality, but it may be called manually in order to verify operation or to complete a configuration step. Only the plugin configuration values are passed during this operation mode.
The plugin writer may simply ingore any or all of the calls to the plugin, depending on the desired functionality. For example, a reporting plugin might only need to handle CREATE events, while a true mitigation plugin most likely will need all events, making use of the UPDATE event to poll the mitigation device for additional information. Alerts in the FlowTraq system will time out after twelve hours, even if the alert condition still persists, in which case a new alert ID will be assigned, and a subsequent "DELETE" and "CREATE" event will be issued.
Every alert has a set of environment variables passed to it. Some of these are sent to every alert of every type. The rest are dependent on the type of alert (as described in ALERT_TYPE. The variables sent to every alert are:
ID - the numeric ID of the alert in the FlowTraq system
EARLIEST_UTC - the timestamp in UTC of the first condition that raised the alert, format: seconds.usec
LATEST_UTC - the timestamp in UTC of the most recent time that the condition persisted
CID - the numeric ID of the partition that this plugin exists in
CID_NAME - the friendlyname of the CID
SEVERITY - the numeric severity (1-10) of the alert
ALERT_TYPE - one of a number of different types, described below
The remaining environment variables are determined by alert type, and are described in the following subsections.
Threshold alerts are those where ALERT_TYPE is threshold_exceeded, and encompass a variety of alert types which may focus on specific traffic groups, interfaces, or individual ports or IP addresses; all of which are called "objects" for the purpose of alerting. Plugins responding to threshold alerts require careful attention to the fact that plugins may be called for a number of different objects, and the OBJECT_TYPE varialb especifies which fields will be valid and specify the object which triggered the plugin. The list below shows the different potential values for OBJECT_TYPE and the fields to expect for each.
OBJECT_TYPE=EXPORTER_ADDR+IFINDEX
EXPORTER_ADDR -- IP address (IPv4 or IPv6) of the exporter
IFINDEX -- Numeric interface index
OBJECT_TYPE=EXPORTER_ADDR+IFINDEX+PROTO+PORT
EXPORTER_ADDR -- IP address (IPv4 or IPv6) of the exporter
IFINDEX -- Numeric interface index
PROTO -- Protocol, numeric
PORT -- Port, numeric.
OBJECT_TYPE=TGRP
TGRP -- Numeric traffic group ID
TGRP_NAME -- Friendlyname of the traffic group
OBJECT_TYPE=TGRP+PROTO+PORT
TGRP -- Numeric traffic group ID
TGRP_NAME -- Friendlyname of the traffic group
PROTO -- Protocol, numeric
PORT -- Port, numeric
OBJECT_TYPE=TGRP+IP
TGRP -- Numeric traffic group ID
TGRP_NAME -- Friendlyname of the traffic group
IP -- IP address (IPv4 or IPv6) of the exporter
In addition to the object itself, each threshold has a unit associted with it. The units of the threshold that was crossed is encoded in the "THRESHOLD_TYPE" environment variable. The actual value of the threshold (in those usits) is given in "THRESHOLD_VALUE", which is a floating point number. So, if THRESHOLD_TYPE is bytes_in and THRESHOLD_VALUE is 100000.0, then the alert was generated because the incoming traffic to the affected object exceeded 100KB/s. Because flow records are reported in bytes, that is the unit used; when bps thresholds are specified in the FlowTraq user interface, they are converted to an approximate Bps threshold for the alerting engine.
THRESHOLD_TYPE -- The type of threshold (always in per-second rates), one of:
bytes_in
bytes_out
packets_in
packets_out
new_conn
updates
uniq_local_endpoint
uniq_remote_cidr
THRESHOLD_VALUE -- Numeric value of the per-second rate of the threshold which was crossed.
Although the alert triggered based on the value of the "THRESHOLD_TYPE" quantity, values for each of the counters are provided in each call the plugin. Current values, average values (for the duration of the alert), and peak values are given in per-second rates. Use the "THRESHOLD_TYPE" to determine the peak, average, and current values of the counter that crossed the threshold value specified in "THRESHOLD_VALUE". The following numeric floating point counters are provided for each call:
PEAK_PACKETS_IN
PEAK_PACKETS_OUT
PEAK_BYTES_IN
PEAK_BYTES_OUT
PEAK_NEW_CONN
AVG_PACKETS_IN
AVG_PACKETS_OUT
AVG_BYTES_IN
AVG_BYTES_OUT
AVG_NEW_CONN
CUR_PACKETS_IN
CUR_PACKETS_OUT
CUR_BYTES_IN
CUR_BYTES_OUT
CUR_NEW_CONN
If the "THRESHOLD_TYPE" was specified as 'uniq_local_endpoint' or 'uniq_remote_cidr' (only available for the "OBJECT_TYPE=TGRP+IP", two additional quantities (helpful in identifying SCAN and WORM behaviors) are given:
PEAK_UNIQ_LOCAL_ENDPOINT
PEAK_UNIQ_REMOTE_CIDR
AVG_UNIQ_LOCAL_ENDPOINT
AVG_UNIQ_REMOTE_CIDR
CUR_UNIQ_LOCAL_ENDPOINT
CUR_UNIQ_REMOTE_CIDR
Denial of service attacks fall into three broad categories in the FLowTraq system: reflection/amplification attacks (such as SMURF, CARGEN, DNS ampflications), flood attacks (such as SYNFLOOD, RSTFLOOD), and low and slow attacks (such as SlowLoris, and RUDY). Trigger points can be configured for each of the major categories, or specifically for port/protocol combinations inside each of the categories. It is also possible to set generic trigger points (not bound to a specific port/protocol) for some of the sub-categories like DDOS_XMAS, DDOS_IPNULL, etc).
When the broad category of "ddos_flood" is configured, the alert may get characterized as any of the following:
ALERT_TYPE=ddos_flood
ALERT_TYPE=ddos_poison
ALERT_TYPE=ddos_frag
ALERT_TYPE=ddos_ipnull
ALERT_TYPE=ddos_tcpnull
ALERT_TYPE=ddos_tcpzero
ALERT_TYPE=ddos_xmas
ALERT_TYPE=ddos_synflood
ALERT_TYPE=ddos_rstflood
ALERT_TYPE=ddos_spectrum
Alerts in the "ddos_amp", and "ddos_slow" categories are always indicated as follows, which the port/protocol specifier differentiating the further attack type:
ALERT_TYPE=ddos_amp
ALERT_TYPE=ddos_slow
Each DDOS attack specifies at least the following environment variables:
TARGET_IP -- The IPv4 or IPv6 address of the system that is under attack.
TARGET_MASK -- The length of the subnet mask that the target address resides in
TARGET_TG -- Traffic group that the target is part of, numeric
TARGET_TG_NAME -- Friendlyname of the traffic group that the target IP is located in
PROTO -- The protocol of the attack traffic (may be 0 in case of an IP_NULL attack)
PORT -- The port that is under attack, or that is used at the reflectors (in case of "ddos_amp")
Note that although a subnet mask is provided, each IP address in the traffic group that is under attack will be tracked by a separate alert. This means your plugin may be called with multiple CREATE events, once for each of the addresses under attack in the traffic group. Furthermore:
THRESHOLD_VALUE -- Numeric value of the trigger point that was crossed. DDoS attacks of the "ddos_flood" and "ddos_amp" type track the rate of inbound packets. The corresponding values to evaluate are given in the "PEAK_PACKETS_IN" environment variables. The "ddos_slow" category uses a network specific index to determine if an attack is ongoing, and does not specify a per-second rate. Additional counter fields available in DDOS style plugin calls (giving per-second rates):
PEAK_PACKETS_IN
PEAK_PACKETS_OUT
PEAK_BYTES_IN
PEAK_BYTES_OUT
PEAK_NEW_CONN
AVG_PACKETS_IN
AVG_PACKETS_OUT
AVG_BYTES_IN
AVG_BYTES_OUT
AVG_NEW_CONN
CUR_PACKETS_IN
CUR_PACKETS_OUT
CUR_BYTES_IN
CUR_BYTES_OUT
CUR_NEW_CONN
If additional source information is available this is specified as well. The "SOURCES" environt variable may specify zero or more remote CIDR blocks that have sent the largest number of packets during this attack. Note that many DDoS attacks spoof their sources addresses, so these fields may be unreliable. The "TOTAL_SOURCES" counter shows the number of remote CIDR blocks that were identified, which may be in the millions or more:
TOTAL_SOURCES -- total number of remote CIDR blocks identified participating in this attack.
SOURCES -- a list of the top remote CIDR blocks that are partiipating in this attack, space separated.
Alerts are generated when an address in the traffic group communicates with an IP address that is on a blacklist. Note that it is possible for both sides of the communications to be on a blacklist (indicated by a non-zero blaclist ID). Blacklist alerts may group multiple connections together if they are between the same two IP addresses. This means that an alert may have multiple server ports associated with it. ALERT_TYPE will always be blacklisted_ip.
Fields for the client side and server side of the communication:
CLIENT_IP -- IP address of the host initiating the connection
CLIENT_BLACKLIST -- Numeric ID of the blacklist that the CLIENT_IP is found on. If 0, then the CLIENT_IP is not on a blacklist
CLIENT_BL_NAME -- Friendlyname of the client blacklist. If client blacklist is 0, this name will not be present.
CLIENT_TG -- Numeric ID of the traffic group that the CLIENT_IP part of.
CLIENT_TG_NAME -- The friendlyname of the client traffic group, if the client TG is 0, this name will be present
SERVER_IP -- IP address of the host to which the connection was made
SERVER_BLACKLIST -- Numeric ID of the blacklist that the SERVER_IP is found on. If 0, then the CLIENT_IP is not on a blacklist
SERVER_BL_NAME -- Friendlyname of the server blacklist. If server blacklist is 0, this name will not be present.
SERVER_TG -- Numeric ID of the traffic group that the SERVER_IP part of.
SERVER_TG_NAME -- The friendlyname of the server traffic group, if the server TG is 0, this name will be present
PROTO -- The IANA protocol number for the protocol used
SERVER_PORT -- The server port of the first communication between the two addresses
CONNECTION_COUNT -- Number of connections between the two addresses
If more than one server port was seen between the two addresses, a list of additional ports may be present:
TOTAL_PORTS -- Total number of additional server ports seen
ADDITIONAL_PORTS -- Space separated list of additional server ports.
Data exfiltration alerts are generated when a trigger policy is defined for a traffic group. Specifically, an alert is raised if an address in the traffic group sends more than the specified number of octets in a single session to an address that is not in the same traffic group, and not part of the INT blocks of the partition. This means dats exfiltrations focus only on the single sessions, irrespective of which system is acting as the server and which system is acting as the client. Also, the receiving address must be in a different traffic group, or no traffic group at all. Additionally, if the receiving address is part of the list of internal blocks for a given partition, then no alert will be raised. ALERT_TYPE is exfil for all data exfiltration alerts.
The following environment variables are availble. Note that the number of bytes exfiltrated may be an accumulation of multiple sessions that all crossed the trigger point:
SENDER_IP -- Sending IP address. Irrspective of which system acts as the server or the client.
SENDER_TG -- Traffic group of the sending address
SENDER_TG_NAME -- Friendlyname of the sending traffic group
SENDER_PORT -- Port from which the data was send
RECEIVER_IP -- Receiving address.
RECEIVER_TG -- Traffic group of the receiving host, may be 0
RECEIVER_TG_NAME -- Friendlyname of the sending traffic group, if receiving group is 0, this name will not be present
RECEIVER_PORT -- Port on which the data was received
PROTO -- Protocol
BYTES_EXFILTRATED -- Number of octets which flowed from the sender to the receiver (this may be updated with subsequent UPDATE calls to your plugin)
THRESHOLD_VALUE -- Trigger point defined in the alerting policy
If more than one server port was seen between the two addresses, a list of additional ports may be present:
TOTAL_PORTS -- Total number of additional server ports seen
ADDITIONAL_PORTS -- Space separated list of additional server ports.
New server policies defined on a traffic group will raise an alert if there is a bi-lateral communication with a server IP address that is in the traffic group. Servers are tracked by their IP/port combinations, so separate alerts are raised for different ports on the server. Communications must see at least 1 packet each by the server and by the client (the communication is bilateral), and at least 4 packets each way if the RST flag was set (indicating a RST may have been sent as a result of a SYN to a closed port). The ALERT_TYPE is new_server. The following environment variables are available:
SERVER_IP -- Address of the server (this is in the traffic group for which the policy was defined)
SERVER_TG -- Traffic group of the server
SERVER_TG_NAME -- The friendlyname of the server traffic group
PROTO -- Protocol
SERVER_PORT -- Each server port will be tracked separately
New Server alerts are often paired with a New Client alert when both policies are set, as the client associated with the first observation of a new service is by default itself new.
New client detection tracks unique client IP addresses communicating with a known server IP/port combination in the traffic group on which the policy was defined. ALERT_TYPE is new_client. The following environment variables are available:
SERVER_IP -- Address of the server (this is in the traffic group for which the policy was defined)
SERVER_TG -- Traffic group of the server
SERVER_TG_NAME -- The friendlyname of the server traffic group
PROTO -- Protocol
SERVER_PORT -- Each server port will be tracked separately
CLIENT_IP -- IP address of the new client that connected to the service in the traffic group.
Each plugin can annotate the alert that called it with a set of key/value pairs, for later retrieval or graphing. The value in each case must be a positive integer. Alert annotation is performed by invoking ftnbi with the following environment variables, which are in turn provided directly by FlowTraq when it calls the plugin script:
TKN -- One-time access token, only good for augmenting this action and this alert
ID -- Alert ID
AID -- Action ID
Error messages you might encounter when using 'ftnbi -val' to update an alert action with auxillary data:
"Key block was found, but unable to allocate new value block" – The alert and action were found, and the key was found as well, however, insufficient value blocks exist in memory to store this value.
"Could not allocate new key block" – The alert and action were found, however, insufficient key blocks exist in memory to store this value.
"Failed to store key for this alert action" – The system ran out of space to store data with an alert action.
"Too many keys for this alert action (max: 128 per action)" – Each alert action may only have 128 distinct keys associated with it.
"Too many values for this key (max: 770 per key)" – Each key may have up to 770 values stored.
"Too many keys for this alert (max: 512 per alert)" – Each alert may have multiple actions, however the total number of distinct keys for all the alert actions combined is 512.
"Too many values for this alert (max: 21,000 per alert)" – Each alert may have multiple actions, however the total number of values for all the alert actions and keys combined is 21,000.
"The alert action ID/AID was not found" – The token for updating the alert action was not found. After an action is called, there is limited time (300 seconds) before the alert action can no longer be updated. Note that on very busy systems this time may be shorter.
"Update rejected: token mismatch, or the alert has timed out" – The security token did not match, or the alert is too old.
"The alert can no longer be updated" – The security token is valid, however, the system is recyling alerts rapidly. This alert action can no longer be updated.
"The alert was not found in memory" – The security token is valid, but the alert was not found in the memory alert cache. The alert action can no longer be updated.
"The alert is too old and cannot be updated" – The alert was found, but the window for updating this alert has closed.
There are only two required files for a FlowTraq Plugin, an executable script file and a JSON-formatted plugin definition named gui.json. The executable may be any kind of Linux executable that is able to accept environment variables and command line arguments; typically either shell scripts of Python files are used, but Perl, PHP, compiled C, or a variety of other executables may used. The executable is run with the same permissions as the FlowTraq se
Each FlowTraq plugin requires a file named gui.json that describes how FlowTraq should communicate with your plugin, including how to describe it, how to configure it, and how to interpret its annotations. This file is first used to describe the plugin to users on the Plugins page.
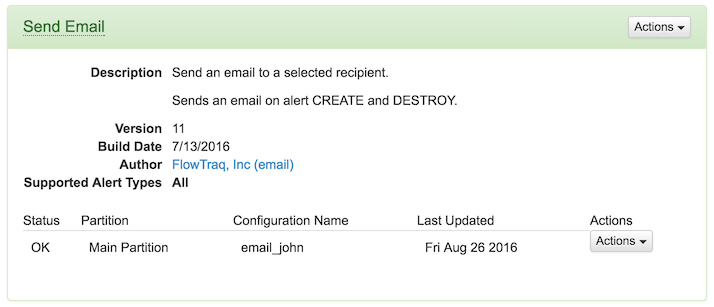
The gui.json file has multiple parts. Here is an example file, adapted from the email plugin, which produces the above panel in the FlowTraq UI.
        {
        	"label": "Send Email",
            "buildDate": 1466615162000,
            "version": 11,
            "description": ["Send an email to a selected recipient.", "Sends an email on alert CREATE and DESTROY."],
            "url": "http://www.flowtraq.com",
            "author": "FlowTraq, Inc",
            "mailto": "support@flowtraq.com",
            "executable": "plugin.py",
            "supportedAlertTypes": ["*"],
            "configurationFields": [
                {
                    "label": "Username",
                    "key": "EMAIL_USERNAME",
                    "allowOverride": false,
                    "fieldspec": {
                        "type": "text",
                        "minlength": 2,
                        "maxlength": 64,
                        "required": false
                    }
                },
                {
                    "label": "Password",
                    "key": "EMAIL_PASSWORD",
                    "allowOverride": false,
                    "fieldspec": {
                        "type": "password",
                        "minlength": 2,
                        "maxlength": 64,
                        "required": false
                    }
                },
                {
                    "label": "Mailport",
                    "key" : "EMAIL_MAILPORT",
                    "allowOverride": false,
                    "fieldspec" : {
                          "type": "int",
                          "value": "587",
                          "min": 0,
                          "max": 65000
                          }
                }
                {
                    "label": "Message Body",
                    "key" : "EMAIL_BODY",
                    "helptext": "Text to include at the top this email",
                    "allowOverride": true,
                    "fieldspec" : {
                        "type": "text",
                        "minlength" : 0,
                        "maxlength" : 1024,
                        "required": false
                    }
                },
                {
                    "label": "Message Footer",
                    "key" : "EMAIL_FOOTER",
                    "helptext": "Text to include at the bottom of this email (cannot be overridden)",
                    "allowOverride": false,
                    "fieldspec" : {
                        "type": "text",
                        "minlength" : 0,
                        "maxlength" : 1024,
                        "required": false
                    }
                }
            ]
        }
This file has a number of entries:
"label" -- The name of the plugin to display on the plugin page (required)
"buildDate" -- the time and date this plugin was built, in milliseconds since the UNIX epoch (required)
"version" -- the integer version number for this plugin (required)
"description" -- either a single string or an array of strings, describing the plugin and how it works
"url" -- the download or support URL
"author" -- the name of the person or company that wrote/published this plugin
"mailto" -- an email address for users to contact for support
"executable" -- the file name of the plugin binary or executable (typically "plugin.sh" or "plugin.py") (required)
"supportedAlertTypes" -- an array of either alert types (e.g. "ddos_flood", "blacklist", etc) or ["*"], indicating which alerts to present this plugin as an option for (required)
"configurationFields" -- an array of configuration variable definitions (required, but may be empty)
The configuration field array contains a set of definitions. Each definition describes the individual configuration items to be requested of the user when creating an instance of your plugin. In the above example, the configuration page generated looks like this:
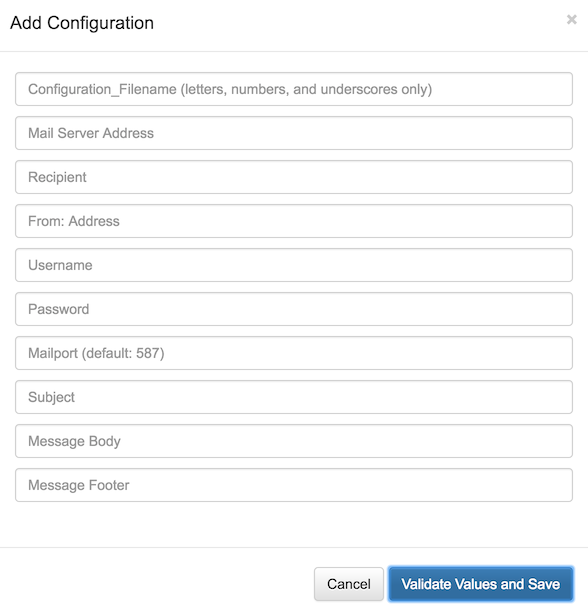
That page contains an entry for each field, and the For example, the configuration field:
                {
                    "label": "Username",
                    "key": "EMAIL_USERNAME",
                    "allowOverride": false,
                    "fieldspec": {
                        "type": "text",
                        "minlength": 2,
                        "maxlength": 64,
                        "required": false
                    }
                }
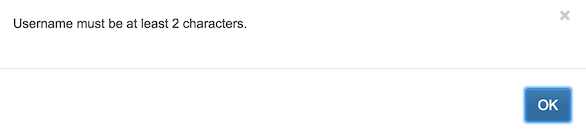
This field describes a variable named "Username", which is not required in order to configure the plugin, expects a text value between 2 and 26 characters, but cannot be overridden when creating an individual policy. If it is filled in, then whenever the plugin is invoked there will be an additional environment variable EMAIL_USERNAME containing the defined string value. FlowTraq enforces the rules described in fieldspec when users create instances of a plugin for later attachment to policies. For example, if a username of only one character is entered for the above entry, the following error is raised and the user cannot proceed:
There are four basic fields needed for each entry:
"label" -- the name shown to the user on the configuration panel, string
"key" -- the name of the environment variable passed to the plugin, string
"allowOverride" -- can this variable be set to a different value by an end user when configuring specific policies (node that this exposes the original value to the user and so should be false for credentials and other sensitive data)
"fieldspec" -- a structure defining the parameters for this variable
The fieldspec structure has several values:
"type" -- the variable type to encode; one of "int", "text", or "boolean"
"minlength" (for "text") -- the minimum string length to accept
"maxlength" (for "text") -- the maximum string length to accept
"min" (for "int") -- the minimum integer value to accept
"max" (for "int") -- the maximum integer value to accept
"value" -- the default value to assign if the user does not specify one (cannot be used for required fields)
"required" -- boolean, determines whether the user must provide a value for this variable
If your plugin retrieves and stores integer values to annotate the alert, and you wish FlowTraq to graph those values in its UI, there is a separate section of the gui.json file that must be added. An example is shown below:
            "containers": ["Volume (Bytes)", "Volume (Packets)", "Volume (Sessions)", "Anomalies"],
            "update_fields": [
                {
                    "label": "UDP Egress Packets",
                    "key": "udp_egress_packets",
                    "container": "Volume (Packets)",
                    "record":"always"
                },{
                    "label": "TCP Total Dropped",
                    "key": "tcp_total_drop",
                    "container": "Volume (Packets)",
                },
                {
                    "label": "IPv4 Bytes Received",
                    "key": "ip_rcv",
                    "container": "Volume (Bytes)"
                }
            ]
There are two fields, each of which contains an array. containers describes the organization of the variables listed in update_fields, and will produce in the alert panel a display like so:
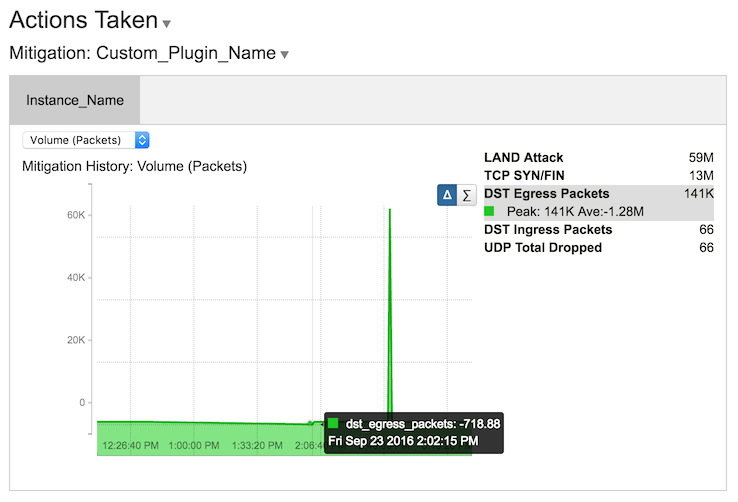
The fields in the update_fields array tell FlowTraq which key/value pairs to look for, how to label them, and what container to put them in. the three required fields for each variable are:
"label" -- the variable type to encode; one of "int", "text", or "boolean"
"key" -- the minimum string length to accept
"container" -- the maximum string length to accept
Other fields can be included, however, for use in the plugin script itself. In the example above, one of the fields contains a "record" value that is not used by FlowTraq, but is used by the FlowTraq Python library. When "record" is "always", the script always includes the value for that key even when it is 0.
