
Below are the most common reasons FlowTraq why may not be displaying the flows that you expect it to. Most of the time, the reason for lack of traffic is one of the following:
- A firewall is blocking inbound flow traffic
The most common cause of missing flow traffic is a firewall blocking the ports needed to receive flow updates.
The firewall may be somewhere on the network or on the FlowTraq host itself. Most systems have host-based firewalls configured to block inbound traffic on certain ports. On some versions of Windows, Windows Firewall blocks flow ports by default; RedHat Enterprise Linux and CentOS also ship with a firewall configured by default. Take a look at your firewall configuration to see if you might have this problem.
Make sure that traffic on UDP/2055 (NetFlow/IPFIX), UDP/9666 and UDP/9996 (cFlow/jFlow), UDP/6343 (sFlow), and any other ports on which you configured flow collection can reach FlowTraq Server.
- FlowTraq is unable to bind the required ports
FlowTraq Server will not be able to collect any flow data if another flow collector is running on the same system because it will be unable to bind the required listen ports.
The
netstattool can tell you which process id or executable has the required ports bound. On UNIX hosts (including Mac OS X),# netstat -a -p
or, on Windows,
# netstat -a -o -b
will, if run with admin permissions, show which processes have bound which ports.
If a process other than
flowtraqhas bound the required UDP ports, you will need to shut down that process or reconfigure both FlowTraq and your NetFlow exporter to use a different port.- Significant system time skew between Client and Server
If FlowTraq Client is running on a machine with a significantly different system clock time than the host running FlowTraq Server, a query for a recent time frame can cause the server to try to fetch sessions that it considers to be in the future or far in the past. In either case, the result set might be empty.
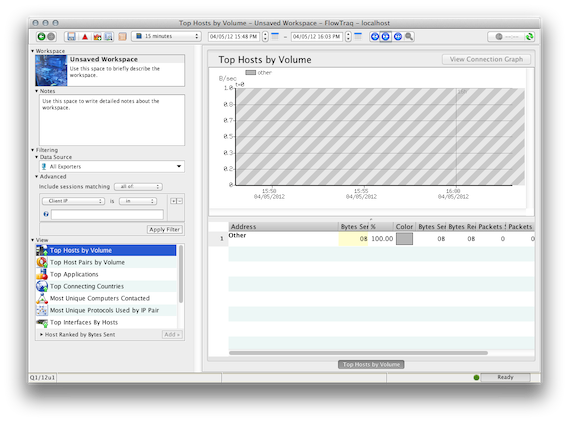
If the cross-hatch area in the graph is covering the entire screen, as pictured below, the client clock is in the future compared to the server clock:
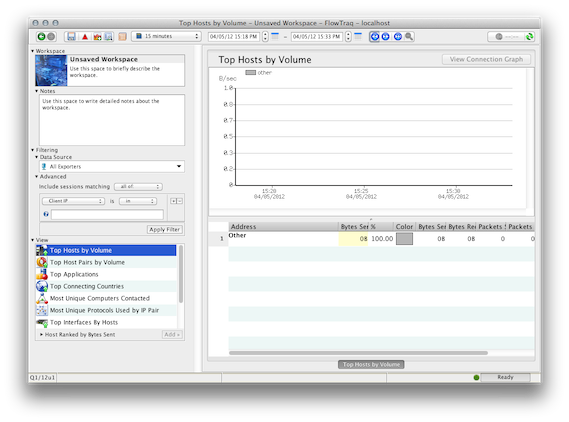
If the cross-hatch area is not showing at all, the client is in the past:
In either case, try moving or extending your time selection back or forward in time until you see a graph showing sessions.
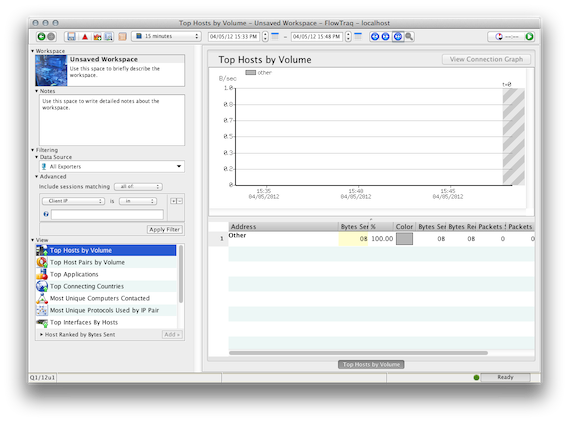
We strongly recommend remedying time skew issues by adjusting system clocks; otherwise, alerts and reports may be also misconfigured. If clocks are aligned, the cross-hatch area should occupy a thin strip on the right only:
- "Template Not Found" (NetFlow v9 and IPFIX only)
The NetFlow v9 and IPFIX formats use a template-based system where the flow export datagram format is described by a template. This format can differ from exporter to exporter, and each exporter will publish a template record approximately every 10 minutes. The collector determines how to parse the NetFlow v9 datagrams from that particular exporter based on the published template. It is possible that flow records are arriving, but no template has yet been seen; in this case, FlowTraq must ignore the records until it receives a template in order to avoid interpreting a record incorrectly. In some cases it might take up to 20 minutes before a template is received.
Check the Exporters tab in the configuration panel. If your NetFlow v9 or IPFIX exporter is shown there, it has successfully sent traffic to FlowTraq Server. However, it may still be waiting for a template record, and until that time, no sessions will appear.
- Incorrectly Configured Exporter
It is possible that the configuration on your exporter is incorrect. For instance, you may have mistyped the destination IP or port, or enabled flow on an unused port.
To verify that your exporter is working correctly, capture some traffic on the host running FlowTraq Server and confirm that flow traffic is arriving at the expected port.
On Unix systems (including Mac OS X), you can use the following tcpdump command to capture UDP/2055 traffic on the interface called IFACE (typically, eth0 or en0):
# tcpdump -i IFACE port 2055
(You may need to use the
ifconfigcommand to determine which interface to capture on.)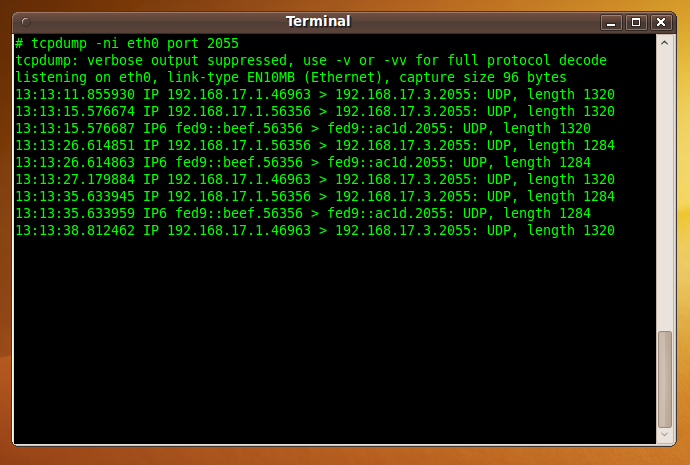
On Windows systems, we recommend the open-source packet-capture software Wireshark for this purpose. Wireshark is available at http://www.wireshark.org/.
