
FlowTraq Workspaces are interactive flow investigations. The Workspace user interface allows you to quickly build reports interactively by setting timeframes and filters at the click of a mouse and selecting views that show the statistics you are most interested in. The Workspace is designed with "pivoting" in mind; if you see something interesting in the data, interact with it to get a better view. For instance, you can drag mouse across a graph to zoom in on a timeframe of interest. Or, you can right-click on a row of a table to quickly filter on the corresponding host, country, application, or other entity.
These are just a few of the things you can do to quickly and interactively gain insight into your network traffic. This section provides a detailed overview of the Workspace window.
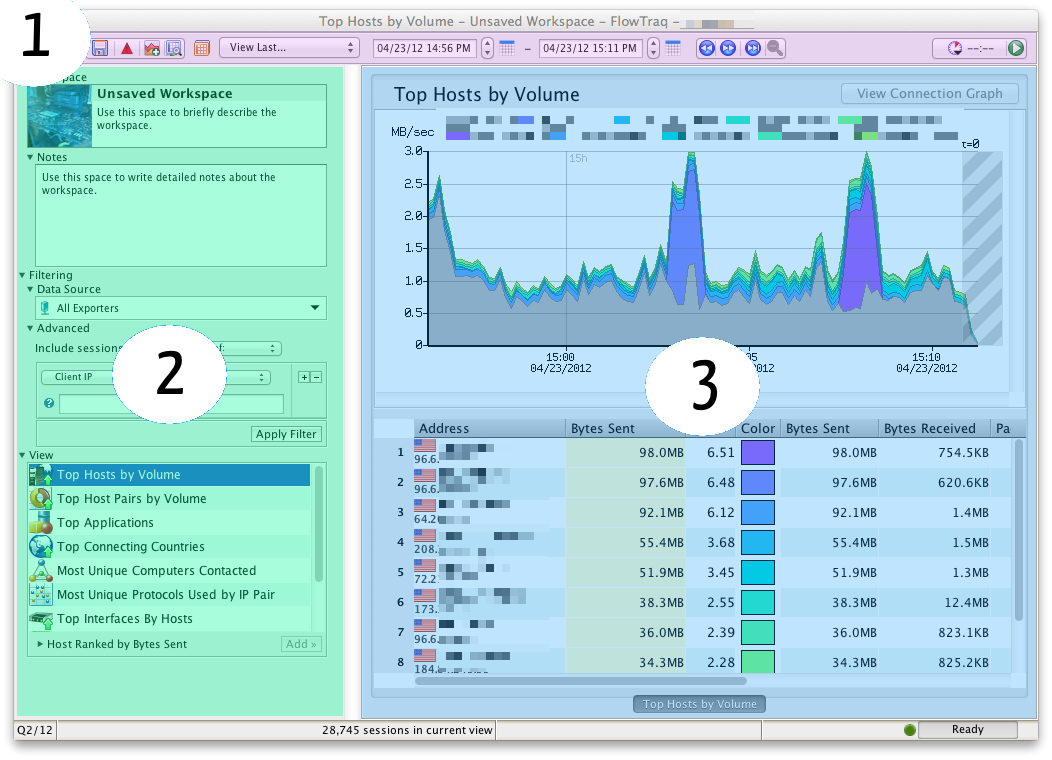
The Workspace window is organized into three major sections:
The toolbar, on top, includes all the timeframe navigation tools, as well as buttons to save a Workspace to the Dashboard, schedule the current Workspace as automated report, generate alert notifications based on the Workspace, open Session Explorer, and set up automatic refresh of the workspace.
The sidebar, on the left, includes the Workspace descriptions as well as all of the filtering and View selection controls.
The main data display shows the results of the current query. Session data is displayed in one or more Views, which are rankings of the session data displayed as a stack chart, a table, and (for pairwise rankings) an interactive connection graph which allows you to visualize connections between entities.
