
The FlowTraq Statistical Query Retrieval command ftstat creates tables and graphs of grouped items that are ranked by some criterion. For example, you can retrieve the list of hosts that sent the most packets during a given timeframe or the list of hosts that received the most packets during the same. You can also find out which port/application accounted for the most bytes on your network, find which host pair exchanged the most bytes, and more.
It is also possible to score by more complex criteria. For instance, it is possible to find the list of hosts that contacted the largest number of unique hosts, or the list of countries that contacted your servers on the largest number of unique server ports.
As with the ftsq command, you must specify a FlowTraq Server to connect to, supply login details, select a timeframe and (optionally) specify a filter. And like ftsq, the results are returned in a formatted table, by default, or in CSV format (use either the -c option for CSV without a header, or the -c+ option for CSV with a header line). Please refer to the complete list of parameters in Section 11.2, “Retrieving Raw Session Data from the Command Line with ftsq”, Section 11.4, “Filter String Syntax” for more information on the filter language syntax, and Section 11.3, “Time Navigation” for information on timeframe specifications.
Where the usage of ftstat differs from that of ftsq is in specifying the desired statistic to calculate. Specify the statistic by using the -grp and -cnt paramaters:
Table 11.7. Statistical Query Parameters
| Parameter | Description |
|---|---|
-grp ENTITY_TYPE
| Create a ranking of the given entity type, one of: IP, IPPAIR, PORTPROTO, QOS, TCPFLAGS, IF, IFPAIR, COUNTRY, VLAN, VLANPAIR, ASN, ASNPAIR, MAC, or MACPAIR. |
-cnt COUNT
|
Rank entities on the specified field, one of:
|
![[Tip]](../common/images/admon/tip.png) | ftstat Example 1 |
|---|---|
To retrieve the top 25 hosts by bytes sent in the last week, use the following command: 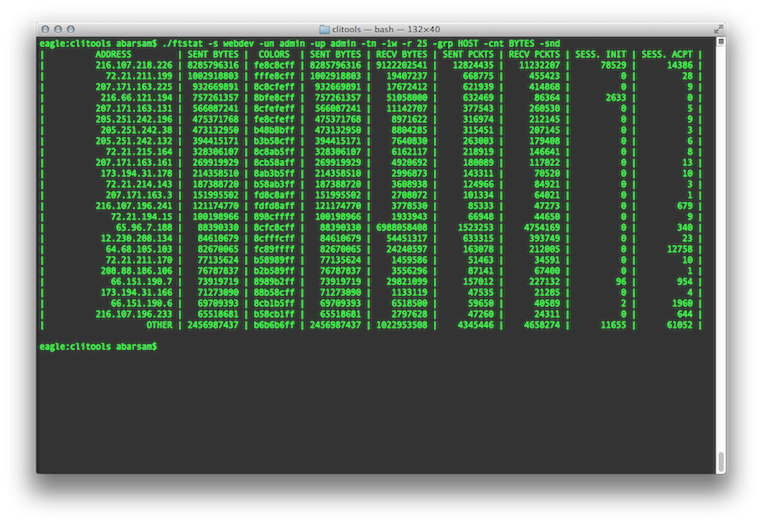 |
| ftstat Example 2 |
|---|---|
To retrieve the five host-pairs that communicated over the largest number of ports during last five hours, use the following command: 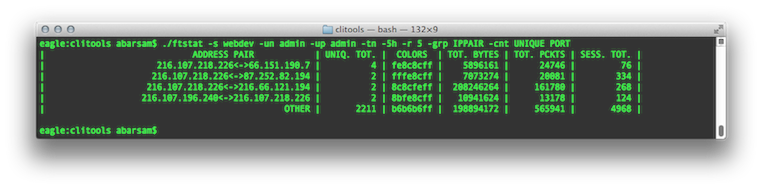 |
| Tip |
|---|---|
You may use the |
| Tip |
|---|---|
You may use the |
