
This section describes how to configure the various alert notification methods.
Alert notifications are automatically displayed on an Alert widget on the Dashboard of the user who set the condition. No action beyond setting the alert condition is necessary to enable alert notifications on the Dashboard.
![[Tip]](../common/images/admon/tip.png) | Tip |
|---|---|
You can configure an Alerts widget to display only alert notifications for alerts above a certain severity. Use multiple Alerts widgets to organize your alert notifications in this way. |
FlowTraq can send alert notifications via e-mail. FlowTraq uses the SMTP protocol to send alert notification e-mails.
Configuring e-mail alert notification is a two-step process. First, an administrative user must supply FlowTraq with the address (or hostname) and port of an SMTP server, and the e-mail address to use in the "From:" field of all outgoing FlowTraq e-mails. Then, each user who wants to receive e-mail notifications must supply the "To:" address to which they would like their notifications delivered.
To configure e-mail notification for the first time, take the following steps:
Log in to FlowTraq as an Administrator.
Click the Preferences button on the Dashboard window's toolbar, or select Edit > Preferences from the menu.
Select the E-mail tab.
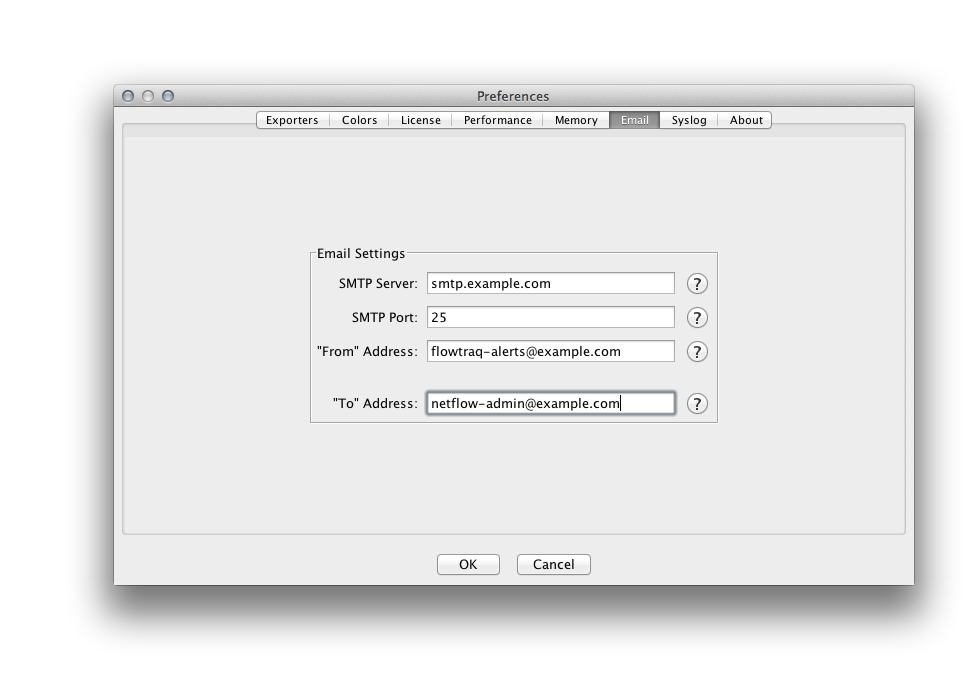
Fill in the address (or hostname) of the SMTP server and the port on which is it listening.
![[Important]](../common/images/admon/important.png)
Important FlowTraq does not support SMTP authentication or encryption. Ensure that the SMTP server is configured to allow unauthenticated, unencrypted connections.
Important The SMTP server must be reachable by FlowTraq Server. Ensure that router and firewall settings allow FlowTraq Server to reach the SMTP server at the configured port.
Tip Leave this field blank to disable e-mail notifications system-wide.
Fill in the desired "From:" address.
"From:" Address This address will be used for all outgoing FlowTraq e-mails.
Fill in the desired "To:" address.
"To:" Address This address will be used for all alert notifications for the currently logged-in user only.
Tip Leave this field blank to disable e-mail notifications for the logged-in user.
Click "OK". (A test e-mail will be sent to the "To:" address.)
| Important |
|---|---|
Unprivileged users may access the E-mail preference panel to change the "To:" address for their own alert notifications. However, they may not change the SMTP server, port, or "From:" address. |
FlowTraq can send alert notifications via syslog over UDP in order to facilitate integration with third-party SIEM systems.
To configure syslog notifications, take the following steps:
Log in to FlowTraq.
Click the Preferences button on the Dashboard window's toolbar, or select Edit > Preferences from the menu.
Select the Syslog tab.
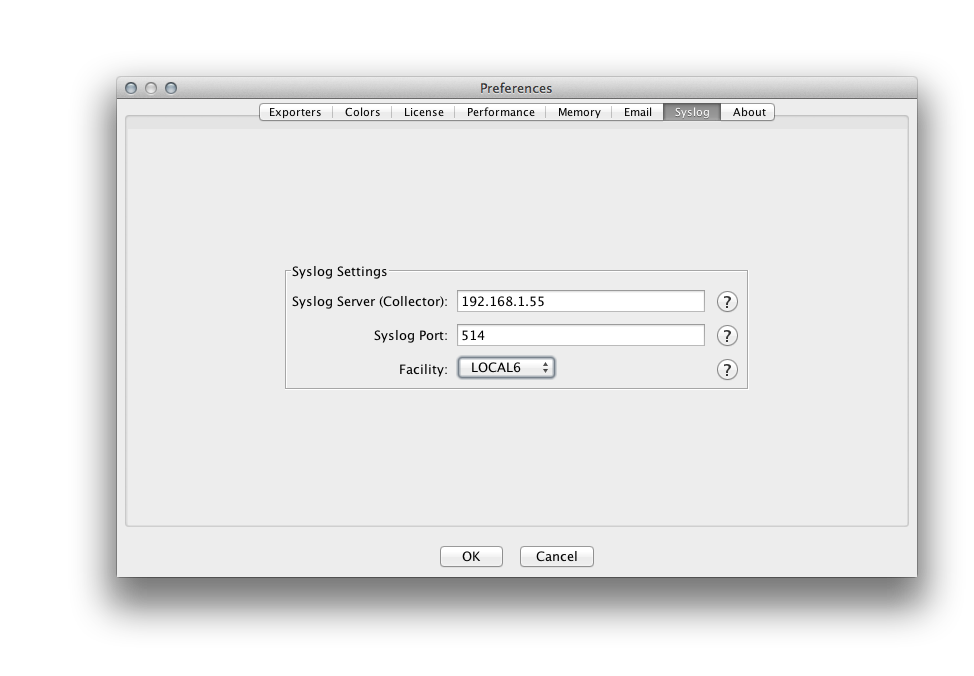
Supply the address (or hostname) of the syslog collector and the port on which it is listening for syslog over UDP. Then select the desired syslog facility.
Important This configuration be used for all alert notifications for the currently logged-in user only.
Important The syslog collector must be reachable by FlowTraq Server. Ensure that router and firewall settings allow FlowTraq Server to reach the collector at the configured port.
Tip Leave this field blank to disable syslog notifications for the currently logged-in user.
Click "OK".
| Important |
|---|---|
The command line interface (CLI) is described in detail in Chapter 11, Command Line Interface. |
FlowTraq notifications can be retrieved via the CLI. This allows you to tie arbitrary scripts to each alert as it is raised. To do this, take the following steps:
Using FlowTraq Client, define alerts based on the conditions that you want to act on. (Note: It might make sense to create a dedicated user for scripted alerts.)
Retrieve the list of recent alerts by using the
-al,-au, and-atparameters with any of the statistical command line tools (e.g.ns2hostsb). For example,/opt/flowtraq/cmdline/ns2hostsb -s flowtraq.example.com / -un alertuser -up MASKED -al -au alertuser -at -3m
This command connects to the FlowTraq Server at
flowtraq.example.comas useralertuser. The-at -3mrequests all the alerts generated for this user in the last 3 minutes.The output of this command might look something like this:
						04/11/2012 01:57:03.569706  1 MEDIUM "Upper threshold /
						exceeded on sessions initiated for address /
						xxx.xxx.xxx.xxx." ID=11 type=ANALYTICAL /
						state=NOT-ACKNOWLEDGED user=alertuser /
						v1=17 v2=10

						04/11/2012 10:50:03.811054  1 MEDIUM "Upper threshold /
						exceeded on bytes sent for address xxx.xxx.xxx.xxx." /
						ID=13 type=ANALYTICAL state=NOT-ACKNOWLEDGED /
						user=alertuser v1=48 v2=1
Legend:
						MM/DD/YY HH:MM:SS.usec ALERTDEF SEVERITY "MESSAGE" /
						ID=id TYPE=type state=STATE user=USER v1=COUNT /
						v2=THRESHOLD
MM/DD/YY HH:MM:SS.usecrepresents the most recent occasion that the referenced ENTITY (host, host pair, country, or port) triggered the alert.ALERTDEFis an integer that uniquely identifies the alert condition.SEVERITYis the severity you selected when you defined the triggered alert, one of INFO, LOW, MEDIUM, HIGH, or CRITICAL.MESSAGEis a textual representation of the condition which triggered the alert, typically of the form "Upper threshold exceeded on [METRIC] for [ENTITY TYPE] [ENTITY]".ID, TYPE, STATE,andUSERcan be safely ignored in this context.COUNTis the number of times the referenced ENTITY has caused this alert to trigger. This will be higher if the entity triggers the alert with multiple sessions, or if a triggering session spans mutiple alerting periods.THRESHOLDis the threshold you set when you defined the triggered alert.Write a script that consumes the above format, parses out the details you need to guide your action, and takes your desired action. If you are familiar with
/bin/bash, you might find the following example a helpful starting point:#! /bin/bash function getAlerts() { /opt/flowtraq/cmdline/ns2hostsb -s flowtraq.example.com / -un alertuser -up MASKED -al -au alertuser -at -1m } while read line do echo "Processing Alert: " $line # add your own code here to parse the details of # the alert and take action accordingly done <<EOF $(getAlerts)Set your script up to run according to a regular schedule (by using
cronor similar) as often as you need it to. If your script runs every minute, use-at 1mto retrieve the alerts notifications generated in the last minute; if it runs every hour, use-at 1h; and so on.
