
To customize a Workspace, begin by launching either an example Workspace (see above) or a new Workspace (select the "New Workspace" button from the Dashboard toolbar or select File > New Workspace from the Workspace menu).
Once a Workspace window is open, you can customize the timeframe, filter, and Views by using the controls in the time navigation toolbar and the sidebar.

The time navigation toolbar allows you to quickly select commonly used timeframes, specify a time and date range you are interested in, and navigate forward and backward to the previous or next time segment. This toolbar also allows you to configure automatic refreshing.
To quickly specify a timeframe relative to the current time, use the first two controls on the toolbar: the Time Selection Mode toggle button and the Time Selection dropdown. Use the toggle button to select either the View last... or the Fixed Frame modes, and then use the dropdown to select a timeframe.
![[Tip]](../common/images/admon/tip.png) | Tip |
|---|---|
Both the View last... and the Fixed Frame modes select time frames relative to the current time, and can be used with the auto-refresh, which will refresh the screen with new data at regular intervals. |
By default, the time selection method is View last.... In this mode, the dropdown will show options for the last 15 minutes, 30 minutes, 1 hour, 3 hours, and so on. Selecting any of these will cause the workspace to refresh to the selected time segment.
In Fixed Frame mode, the dropdown contains options for this hour, last hour, today, yesterday, and so on.
| Tip |
|---|---|
If you prefer to specify a timeframe by hand, use the start and end time boxes and spinner controls to specify the times you're interested in. Enter a date, or use the Calendar popup button to quickly navigate to relevant dates. Finally, after entering your timeframe, click the Refresh button to retrieve the data. If you specify a timeframe by hand, any selections you have already made in the Time Selection dropdown are ignored. |
You can navigate to the previous or the next segment in time using the Forward and Backward buttons on the right side of the time navigation bar, and you can quickly move the timeframe so that it ends at the current time by pressing the Forward To Now button.
Finally, in the data display, you can zoom in by dragging the mouse across the graph while holding down the left button. This will zoom in on the selection region and refresh the data automatically.
![[Important]](../common/images/admon/important.png) | Long-Running Sessions |
|---|---|
When a session overlaps the selected timeframe but the start time is before the start of a time frame, or end time is after the end of a time frame, that session's statistics are pro-rated to the timeframe. That is, suppose hosts are being ranked on bytes transferred, and a host has a session that is 50% in the selected timeframe, and 50% out of it; in this case, only half the bytes in the session are counted to that host. |
FlowTraq offers extensive and powerful filtering capabilities. Filters can be configured in the Workspace sidebar, in the Report Scheduler, and in the Alert Scheduler. In all three cases, filters are configured in the same way.
Generally speaking, you configure a filter by combining constraints which specifies which traffic to included or exclude from your investigation. The Filtering panel looks like this:
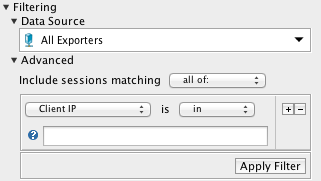
The first constraint you can specify is the data source selection. If you may have more than one flow source reporting flows to FlowTraq Server, you may use the Data Source dropdown to select an exporter or a particular interface on an exporter to use as the data source. (You can also keep the default setting, "All Exporters"). If you choose an exporter or an interface, subsequent reports will include only traffic that was reported by that device, or which passed through that interface.
Subsequent constraints are specified in the Advanced Filter panel. You can form these constraints as easily as you can form English sentences by selecting from dropdowns and completing the fields in a filter box, which is sometimes referred to as a Filter Line. You can also add and remove Filter Lines as you see fit by clicking on the '+' and '-' buttons on each Filter Line.
Most Filter Lines can accept comma-separated sets of host names, CIDR blocks, numeric ranges, or mnenomics (such as "tcp" for protocol), as appropriate to their type. Others, such as the country code selector, provide an interface that allow you to select values. All Filter Lines have a validation icon which indicates if the value entered has been accepted. When you start typing, the validation icon turns into a question mark. When the icon turns green, the filter box value has been accepted and can be applied. If the icon turns red, you have entered an invalid value for the Filter Line, and your input on that Filter Line will be ignored. (You can click the validation icon for an explanation of why your input was rejected.)
| Combining Filter Lines |
|---|---|
By default, Filter Lines are combined by logically "AND"-ing them together. That is, if you specify the following three Filter Lines: A, B, & C, only sessions for which A AND B AND C are true will be included in the report. If you'd like to "OR" them together, change the Combination Rule by changing the dropdown in the that says "Include sessions matching ALL of:" to say "Include sessions matching ANY of:". |
Values entered into a particular Filter Line are combined by logically "OR"-ing them together.
| Filtering Example 1 |
|---|---|
If you want to filter on traffic (to or from) either 172.16.2.2 OR 192.168.12.12, use this filter: 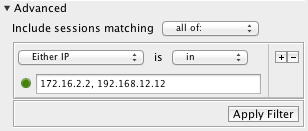 Instead, if you want to filter on traffic between the two addresses (that is, both 172.16.2.2 and 192.168.12.12 are part of the session, but without regard to which is the client and which is the server), then use this filter: 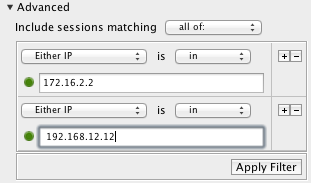 And if you would only like to see traffic where 192.168.12.12 is the server, and 172.16.2.2 is the client, use this filter: 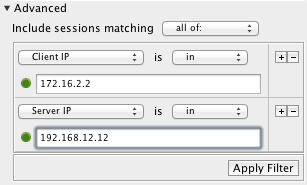 Now, if you want to see traffic that went to either 172.16.2.2 OR 192.168.12.12, used protocol TCP, and went to server port 80 (HTTP), then try this filter: 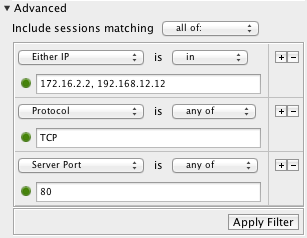 |
| Filtering Example 2 |
|---|---|
In some cases you might want to OR the filter boxes. For instance, suppose your accounting division uses VLAN 5, and the accounting database server is 192.168.12.33. You want to filter on all accounting traffic. In this case you set the combination rule to be "Include sessions matching ANY of:"  This filter includes all traffic on VLAN 5, regardless of destination or protocol, and all traffic going to the accounting server. |
| Filtering Example 3 |
|---|---|
Suppose you have a dedicated VLAN for your IP phones (say, VLAN 6), but you suspect that some of the phones may have been misconfigured and are using bandwidth on the regular bulk data network. The filter to detect this behavior will have to exclude the VOIP VLAN but include all non-bulk TOS traffic to the VOIP servers (say, in the 69.59.241.0/24 class-C block). A filter to find all your rogue VOIP phones might look like this: 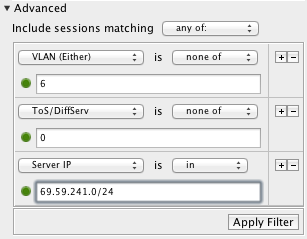 |
| Raw Filter Strings |
|---|---|
You can view the raw filter string corresponding to a set of Filter Lines by selecting View > Filter String: 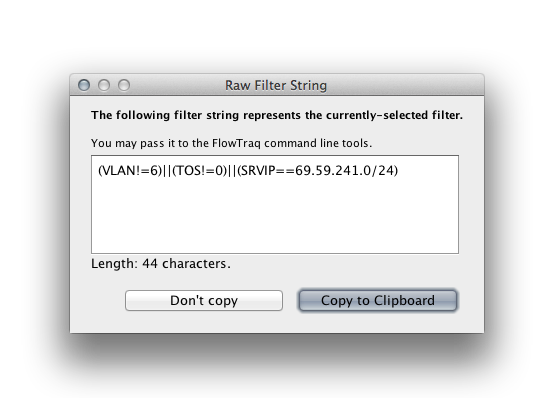 You can use the raw filter string on the command line, or as a starting point for more complex filter strings. If you find that you cannot fashion the filter you need to using the Filter Line interface, you can enter a raw filter string by selecting "raw query:" as the Combination Rule: 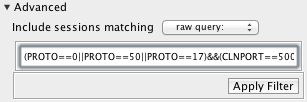 See Section 11.4, “Filter String Syntax” for more information on the filter language syntax. |
Below is the full list of fields that can be filtered on:
- IP address/hostname/CIDR block
The most common filter is a host filter or address block filter. You may specify client, server, or both. This is useful, for instance, if you want to find all inbound connections to your web server, but are not interested in outbound connections that the web server initiates itself.
Valid inputs are IPv4 addresses in dotted-decimal notation; IPv6 addresses; hostnames (be sure to wait for the validation icon to indicate the name was successfully resolved); and CIDR blocks (both IPv4 and IPv6). CIDR blocks are a convenient way of specifying an entire subnet; for example, use 192.168.12.0/24 to include all addresses from 192.168.12.0 to 192.168.12.255.
- MAC Address
Filter on the MAC addresses in the session, as reported by the exporter (IPFIX fields 56 and 80).
- Port
Filter on the port number. It is possible to specify a range of ports by choosing
between; enter ranges using a dash. For example, selectingbetweenwith a value of "10000-20000" will find all sessions with port numbers between 10,000 and 20,000.- Protocol
Filter on a protocol. Accepted mnemonics are TCP, UDP, and ICMP. Numeric protocol values are also allowed.
- Country
Filter on sessions to or from a particular country. Click the "Edit" button to get a list of countries, and select countries to include in the filter by toggling their country-code button. A list of selected countries and their flags will appear in the Filter Line.
- Bytes
Filter on session byte volume. For instance, if you only want to view sessions where the client sent at least 500 bytes, then select "Client Bytes", "at least", and supply the value "500" in the input field.
Important Selecting "Either Bytes" does NOT sum the client and server-side bytes together. Rather, it acts as a logical OR. Use "Total Bytes" to filter on the total bytes.
- Packets
Filter on session packet volume. In all ways analogous to Bytes.
- ToS/DiffServ
Filter sessions based on the value in their ToS or DiffServ field. The values are numeric, so you might need to specify a range to get the desired effect.
Important Note that this field has a different meaning for IPv4 and IPv6.
- Flow Duration
Filter sessions based on their duration. This field is numeric and given in seconds.
Tip From a security perspective, it may be useful to filter on particularly long-lived connections. To do so, select the "at least" option and supply a value of 7200 in the input field to include only sessions that lasted at least 2 hours.
- VLAN
Filter on the session's VLAN numbers.
VLANs are a convenient way to group classes of systems together. VLAN specifiers are numbers between 1 and 4096. Most sessions will have the same VLAN ID for both VLAN In and VLAN Out. Devices that route packets between VLANs will export flows where the VLAN In and VLAN Out differ. When VLANs are not used, this value is commonly set to 0.
Exporter VLAN Support Not all flow sources include VLAN information in their flow updates. In particular, NetFlow v5 does not include VLAN information, and some versions of cFlow, and jFlow also do not.
- ASN
Filter on the session's Autonomous System Numbers. Some routers keep BGP tables to make routing decisions at the autonomous system level. These routers may include the ASN of the client and the server address in the flow records. You can use this option to filter on this field.
- Interface
Filter on the exporter-reported Interface In and Interface Out numbers of the session.
This serves a similar function to the feature provided by the Data Source selection box. Use this if you want to filter on more than one interface, but not all interfaces.
Interface numbers range from 1-65536. A value of 0 indicates no interface number was present in the flow records.
- Exporter IP
Filter on the IP address of the exporter which reported the session.
This serves a similar function to the feature provided by the Data Source selection box. Use this if you want to filter on more than one exporter, but not all exporters.
- Exporter Version
Filter on the NetFlow/sFlow version of the exporter which reported the session. Click the "Edit" button to get a list of versions, and select versions to include in the filter by toggling their buttons. A list of selected versions and their badges will appear in the Filter Line.
- NSEL Event
Filter on the NSEL event code of the session. Typically, NSEL events correspond to a flow being accepted, denied, or deleted by the firewall.
Click the "Edit" button to get a list of event codes, and select event codes to include in the filter by toggling their buttons. A list of selected event codes and their numbers will appear in the Filter Line.
- NSEL Ext. Event
Filter on the NSEL extended event codes of the session. Typically, NSEL extended event codes explain why a flow was denied by the firewall.
Click the "Edit" button to get a list of event extended codes, and select event codes to include in the filter by toggling their buttons. A list of selected event codes and their numbers will appear in the Filter Line.
FlowTraq has the ability to rank your selection of traffic in hundreds of different ways. Each such ranking is called a View. Being able to analyze traffic from multiple angles often reveals unexpected details, so Workspaces can show many Views at once, in tabs.
| Important |
|---|---|
You must have add least one View to the Workspace before you can retrieve and analyze traffic. |
In general, each View consists of a stack chart and a table which serves as a legend for the stack chart. Stack charts are a convenient way to visualize ranked data over time. The top-ranked item appears at the bottom of the graph; stacked on top of it is the second-ranked item; and so forth:
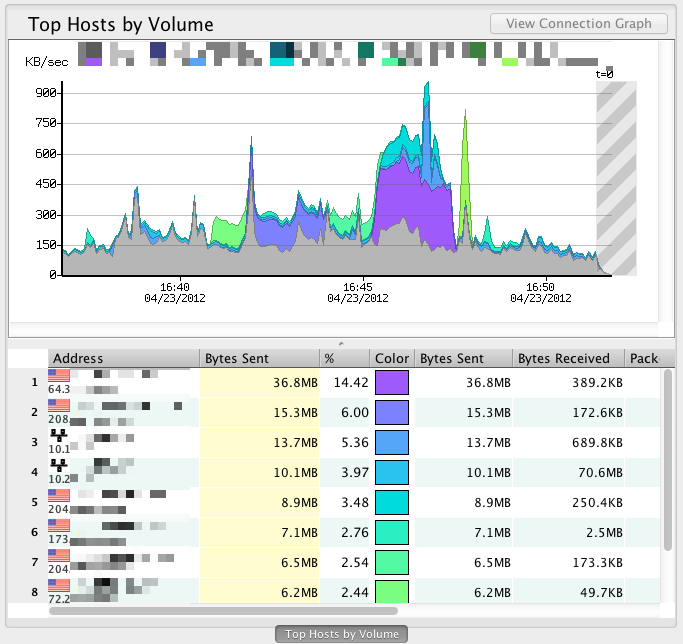
The grayed-out crosshatch area on the chart roughly indicates the present time. More specifically, it indicates when insufficient flow data has been received to compile a completely accurate representation of the traffic. In general, the crosshatch area starts at about 60 seconds into the past, and extends indefinitely into the future.
Tables show the same data as the chart above them, but in a sortable table format. In fact, you can click on any part of the chart and FlowTraq will highlight the corresponding row in the table below.
| Tip |
|---|---|
Use the View > Top-10, View > Top-25, ..., View > Top-1000 items in the Workspace menu to indicate how many rows FlowTraq should include in its rankings. |
You can right-click on any item in the table to see contextual options (for instance, you can add an item to your session filter).
You can also change the widths of the columns and rearrange columns for your convenience. (This setting is remembered on a user-by-user basis.)
By default, the second column in the graph is highlighted. This is the column that was used to perform the ranking. In the example, above the data was sorted based on the number of bytes sent by each host. This means that the items in the table are the top hosts, ranked by bytes sent.
The columns further to the right give additional insight into the top hosts.
| Important |
|---|---|
Although you can sort by the non-highlighted columns, they do not constitute a ranking by themselves. That is, if you re-sorted the above table by "Sessions Initiated," you will see the hosts that initiated the largest number of sessions that also happened to make it into the original ranking, which was "Top Hosts by Bytes Sent." In order to make a "Top Hosts by Sessions Initiated" ranking, you must add a new View in a separate tab. This is described below. |
| Tip |
|---|---|
Pairwise Views can also be visualized as Connection Graphs. See Section 6.3.3.4, “The Connection Graph” for more information. |
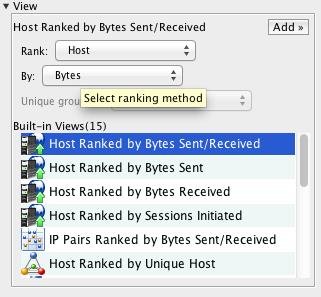
FlowTraq provides a number of built-in Views, which represent the most frequently used rankings.
To add a built-in View to a Workspace, select it from the View table and select "Add".
Built-in Views only scratch the surface of FlowTraq's capabilities. Use Custom Views to explore the unique properties of your network.
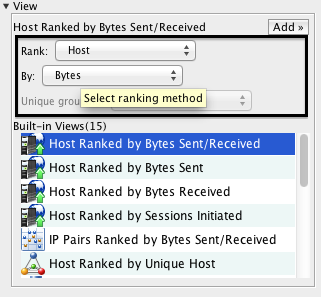
To define a custom view, select "Custom View..." in the View table, make your selections using the dropdown menus which appear, and click "Add" to add the view as a tab in the workspace.
Views are defined by selecting what entity to Display (or rank), and what aspect of that entity to rank. For instance, "Display: VLAN Ranked by Packets" will show you the top VLANs based on the number of packets that were seen on that VLAN during the specified timeframe. On the other hand, "Display: VLAN Ranked by Bytes" will show the top VLANs based on the number of bytes seen. You may get a completely different ranking, because the byte volume of traffic can differ significantly from the packet volume on a given VLAN.
| Tip |
|---|---|
Take some time to familiarize yourself with the pairwise View (such as rankings of IP pairs) and unique-count Views (such as "Top Hosts Ranked by Unique Host"), as they are among the most powerful kinds of Views. |
Defining your own View can be a powerful way to explore your traffic.
Each View you add to a Workspace becomes a tab in the data display. Select the tab to show that View in the display.
| View Tab Limitations |
|---|---|
You can add up to ten concurrent Views in the data display. In addition, there are certain rules about which Views can be combined with which other Views. For instance, you can only add 2 View tabs that rank hosts or host pairs. If you attempt to add a View tab when either the maximum number of View tab has already been added, or a conflicting set of View tabs has already been added, the "Add" button will be disabled. This limitation is imposed to limit the memory usage by the server during query processing, and can be worked around by creating a second similar workspace, or by removing one or more View tabs before proceeding. To remove a View, right-click on the View tab and select "Close Tab" to remove it. (Alternatively, select "Close Other Tabs" to remove all Views except the one represented by the selected tab.) 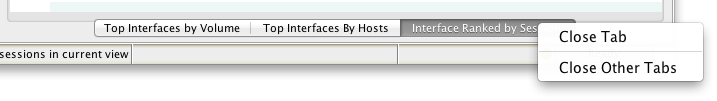 |
When a pairwise View is the active tab, a button labeled "View Connection Graph" is available in the upper right-hand corner of the data display:
Use this button to toggle between the chart/table display and the Connection Graph:
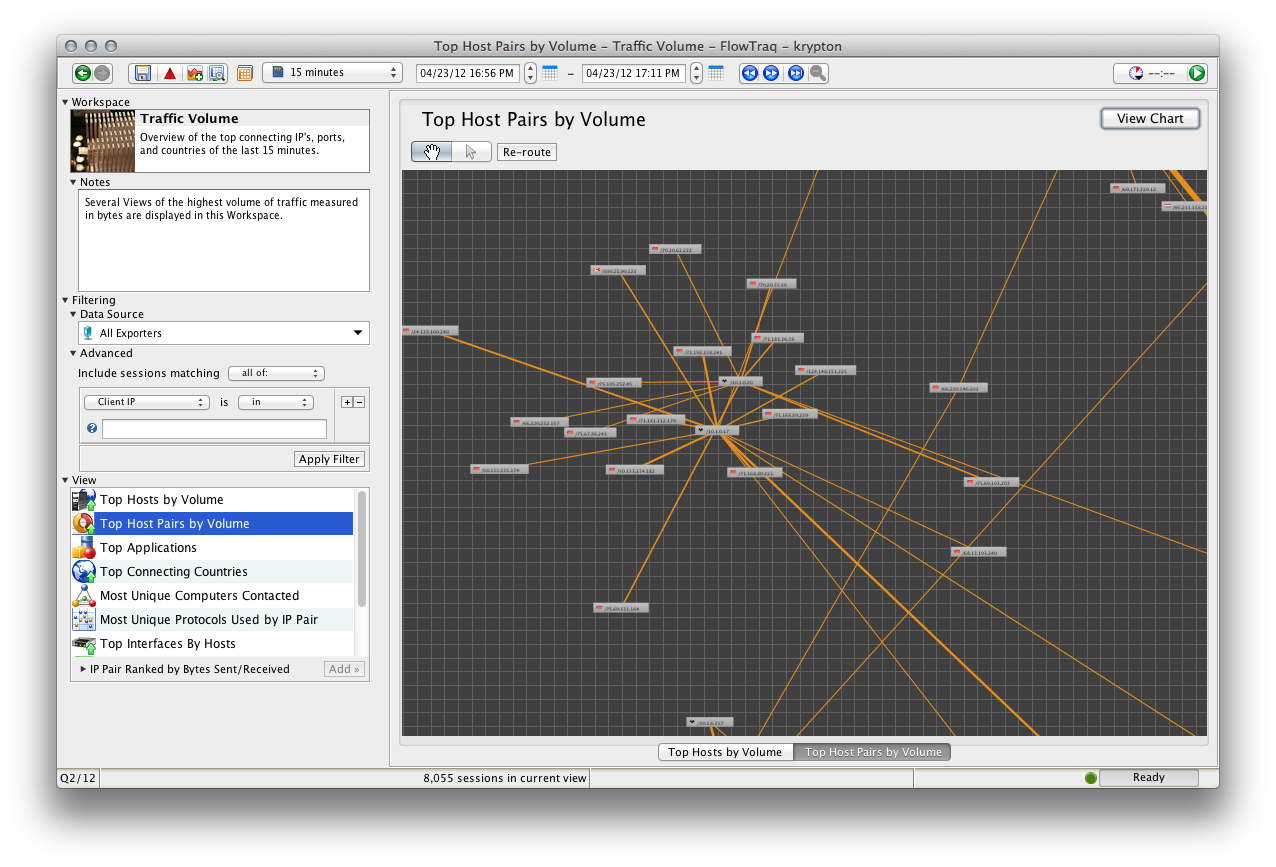
In Connection Graph mode, entities are displayed as badges with lines indicating connections between them.
To navigate the Connection Graph, click the "Hand" icon and drag the mouse within the graph, and zoom in and out using the mouse wheel or trackpad scroll gesture.
To interact with entities on the Connection Graph, click the "Cursor" icon, and then click or drag to select entities or groups of entities. Once selected, entities can be rearranged by dragging, or right-clicked to present a contextual menu.
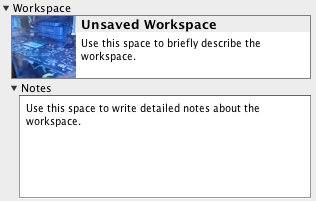
FlowTraq provides you with spaces in the sidebar to briefly describe your Workspace and make notes to remind you of the status of your investigation. Feel free to use these spaces in ways you find appropriate.
In addition, you may select a Workspace icon to help you quickly identify your Workspace in the Workspaces widget. To do so, click on the icon in the Workspace badge and an icon chooser will appear:
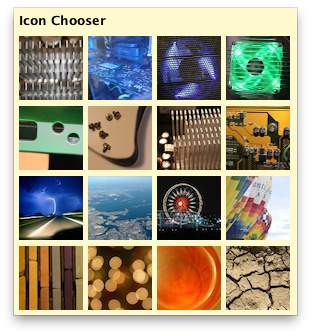
Click on the desired icon to select it.
